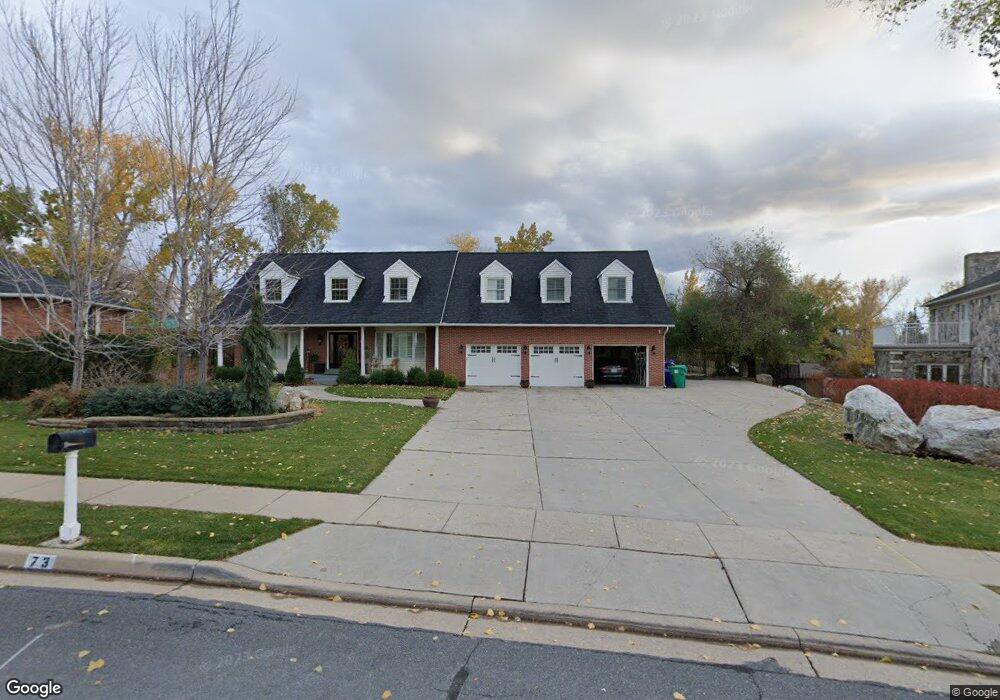
73 W 1600 N Centerville, UT 84014
Estimated Value: $912,000 - $1,050,210
5
Beds
4
Baths
3,580
Sq Ft
$276/Sq Ft
Est. Value
About This Home
This home is located at 73 W 1600 N, Centerville, UT 84014 and is currently estimated at $988,053, approximately $275 per square foot. 73 W 1600 N is a home located in Davis County with nearby schools including Reading School, Centerville Jr High, and Viewmont High School.
Ownership History
Date
Name
Owned For
Owner Type
Purchase Details
Closed on
Sep 10, 2020
Sold by
Russell Ronald G and The Ronald G Russefl Revocable
Bought by
Perkins Porter and Perkins Aimee
Current Estimated Value
Home Financials for this Owner
Home Financials are based on the most recent Mortgage that was taken out on this home.
Original Mortgage
$510,400
Outstanding Balance
$451,916
Interest Rate
2.9%
Mortgage Type
New Conventional
Estimated Equity
$536,137
Purchase Details
Closed on
Dec 28, 2011
Sold by
Russell Ronald G
Bought by
Russell Ronald G
Create a Home Valuation Report for This Property
The Home Valuation Report is an in-depth analysis detailing your home's value as well as a comparison with similar homes in the area
Purchase History
We collect this data history from publicly available records. To have your information removed, we recommend requesting removal directly through your county’s website.
| Date | Buyer | Sale Price | Title Company |
|---|---|---|---|
| Perkins Porter | -- | Metro National Title | |
| Russell Ronald G | -- | None Available |
Source: Public Records
Mortgage History
We collect this data history from publicly available records. To have your information removed, we recommend requesting removal directly through your county’s website.
| Date | Status | Borrower | Loan Amount |
|---|---|---|---|
| Open | Perkins Porter | $510,400 |
Source: Public Records
Tax History
| Year | Tax Paid | Tax Assessment Tax Assessment Total Assessment is a certain percentage of the fair market value that is determined by local assessors to be the total taxable value of land and additions on the property. | Land | Improvement |
|---|---|---|---|---|
| 2025 | $5,736 | $514,800 | $190,942 | $323,858 |
| 2024 | $5,397 | $495,000 | $178,878 | $316,122 |
| 2023 | $5,482 | $868,000 | $283,858 | $584,142 |
| 2022 | $5,381 | $474,100 | $145,263 | $328,837 |
| 2021 | $4,880 | $678,000 | $232,784 | $445,216 |
| 2020 | $4,216 | $601,000 | $221,713 | $379,287 |
| 2019 | $4,236 | $593,000 | $204,188 | $388,812 |
| 2018 | $3,992 | $554,000 | $188,518 | $365,482 |
| 2016 | $3,254 | $252,230 | $66,777 | $185,453 |
| 2015 | $3,328 | $245,190 | $66,777 | $178,413 |
| 2014 | $3,133 | $237,353 | $66,777 | $170,576 |
| 2013 | -- | $224,703 | $54,967 | $169,736 |
Source: Public Records
Map
Nearby Homes
- 1683 N Main St
- 1549 N 400 W
- 43 Peachtree Dr
- 354 S 525 W
- 393 S 525 W
- 374 S 525 W
- 373 S 525 W
- 386 S 525 W
- 145 Ford Canyon Dr
- 290 W 1350 N
- 349 Ford Canyon Dr
- 1833 N 350 E
- 1959 N 150 E
- 586 W 1950 N
- 0 N Rolling Hills Dr E Unit 2158279
- 1930 N 750 W
- 1167 Deerfield Dr
- 5 W Summerhill Ln
- 257 W 1125 N
- 371 W 1125 N
Your Personal Tour Guide
Ask me questions while you tour the home.