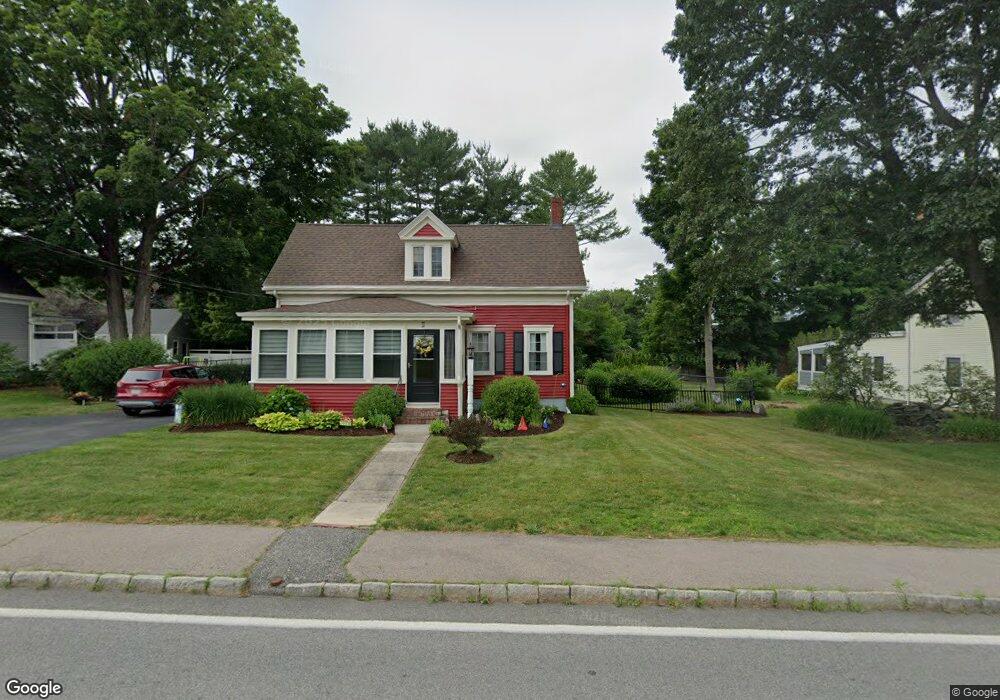
73 Walnut St Abington, MA 02351
Estimated Value: $533,000 - $566,000
3
Beds
2
Baths
1,328
Sq Ft
$414/Sq Ft
Est. Value
About This Home
This home is located at 73 Walnut St, Abington, MA 02351 and is currently estimated at $550,019, approximately $414 per square foot. 73 Walnut St is a home located in Plymouth County with nearby schools including Beaver Brook Elementary School, Abington Middle School, and Woodsdale School.
Ownership History
Date
Name
Owned For
Owner Type
Purchase Details
Closed on
Jan 24, 2022
Sold by
Faux George L
Bought by
Faux George L and Faux Mary E
Current Estimated Value
Home Financials for this Owner
Home Financials are based on the most recent Mortgage that was taken out on this home.
Original Mortgage
$280,000
Outstanding Balance
$255,148
Interest Rate
2.75%
Mortgage Type
Adjustable Rate Mortgage/ARM
Estimated Equity
$294,871
Purchase Details
Closed on
Jul 30, 2018
Sold by
Faux George L and Faux Mary E
Bought by
Faux George L
Purchase Details
Closed on
Nov 27, 1995
Sold by
Kierstead Hazel V Est
Bought by
Faux George L
Create a Home Valuation Report for This Property
The Home Valuation Report is an in-depth analysis detailing your home's value as well as a comparison with similar homes in the area
Home Values in the Area
Average Home Value in this Area
Purchase History
| Date | Buyer | Sale Price | Title Company |
|---|---|---|---|
| Faux George L | -- | None Available | |
| Faux George L | -- | None Available | |
| Faux George L | -- | None Available | |
| Faux George L | -- | None Available | |
| Faux George L | -- | -- | |
| Faux George L | $119,000 | -- | |
| Faux George L | -- | -- | |
| Faux George L | $119,000 | -- |
Source: Public Records
Mortgage History
| Date | Status | Borrower | Loan Amount |
|---|---|---|---|
| Open | Faux George L | $280,000 | |
| Closed | Faux George L | $280,000 | |
| Previous Owner | Faux George L | $266,000 | |
| Previous Owner | Faux George L | $258,000 | |
| Previous Owner | Faux George L | $50,000 |
Source: Public Records
Tax History
| Year | Tax Paid | Tax Assessment Tax Assessment Total Assessment is a certain percentage of the fair market value that is determined by local assessors to be the total taxable value of land and additions on the property. | Land | Improvement |
|---|---|---|---|---|
| 2025 | $6,304 | $482,700 | $241,800 | $240,900 |
| 2024 | $6,208 | $464,000 | $220,100 | $243,900 |
| 2023 | $5,837 | $410,800 | $191,700 | $219,100 |
| 2022 | $5,624 | $369,500 | $168,100 | $201,400 |
| 2021 | $43 | $317,400 | $152,700 | $164,700 |
| 2020 | $43 | $312,700 | $148,100 | $164,600 |
| 2019 | $10,238 | $285,100 | $141,200 | $143,900 |
| 2018 | $5,417 | $274,500 | $141,200 | $133,300 |
| 2017 | $5,464 | $252,300 | $141,200 | $111,100 |
| 2016 | $4,405 | $245,700 | $134,600 | $111,100 |
| 2015 | $4,160 | $244,700 | $134,600 | $110,100 |
Source: Public Records
Map
Nearby Homes
Your Personal Tour Guide
Ask me questions while you tour the home.