73 Walnut St Abington, MA 02351
Estimated Value: $496,000 - $562,311
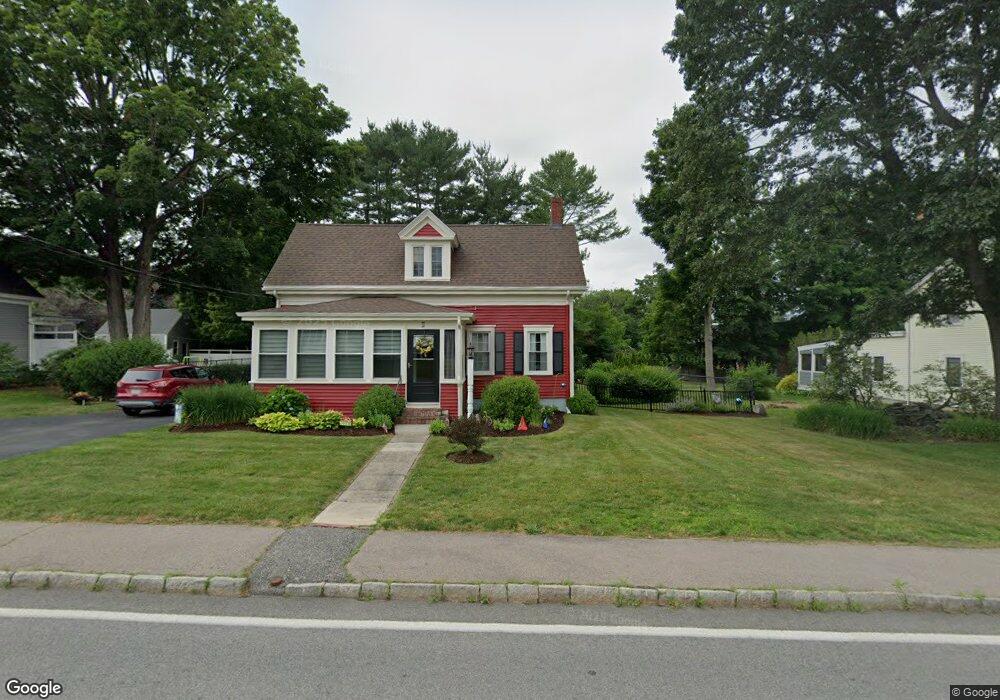
About This Home
This home is located at 73 Walnut St, Abington, MA 02351 and is currently estimated at $535,828, approximately $403 per square foot. 73 Walnut St is a home located in Plymouth County with nearby schools including Beaver Brook Elementary School, Abington Middle School, and Woodsdale School.
Ownership History
We collect this data history from publicly available records. To have your information removed, we recommend requesting removal directly through your county’s website.
Purchase Details
Home Financials for this Owner
Home Financials are based on the most recent Mortgage that was taken out on this home.Purchase Details
Purchase Details
Home Values in the Area
Average Home Value in this Area
Purchase History
We collect this data history from publicly available records. To have your information removed, we recommend requesting removal directly through your county’s website.
| Date | Buyer | Sale Price | Title Company |
|---|---|---|---|
| -- | None Available | ||
| -- | None Available | ||
| -- | None Available | ||
| -- | None Available | ||
| -- | -- | ||
| $119,000 | -- | ||
| -- | -- | ||
| $119,000 | -- |
Mortgage History
We collect this data history from publicly available records. To have your information removed, we recommend requesting removal directly through your county’s website.
| Date | Status | Borrower | Loan Amount |
|---|---|---|---|
| Open | $280,000 | ||
| Closed | $280,000 | ||
| Previous Owner | $266,000 | ||
| Previous Owner | $258,000 | ||
| Previous Owner | $50,000 |
Tax History
We collect this data history from publicly available records. To have your information removed, we recommend requesting removal directly through your county’s website.
| Year | Tax Paid | Tax Assessment Tax Assessment Total Assessment is a certain percentage of the fair market value that is determined by local assessors to be the total taxable value of land and additions on the property. | Land | Improvement |
|---|---|---|---|---|
| 2025 | $6,304 | $482,700 | $241,800 | $240,900 |
| 2024 | $6,208 | $464,000 | $220,100 | $243,900 |
| 2023 | $5,837 | $410,800 | $191,700 | $219,100 |
| 2022 | $5,624 | $369,500 | $168,100 | $201,400 |
| 2021 | $43 | $317,400 | $152,700 | $164,700 |
| 2020 | $43 | $312,700 | $148,100 | $164,600 |
| 2019 | $10,238 | $285,100 | $141,200 | $143,900 |
| 2018 | $5,417 | $274,500 | $141,200 | $133,300 |
| 2017 | $5,464 | $252,300 | $141,200 | $111,100 |
| 2016 | $4,405 | $245,700 | $134,600 | $111,100 |
| 2015 | $4,160 | $244,700 | $134,600 | $110,100 |
Map
- 34 Brockton Ave
- 23 Belmont St
- 9 Lydon Ln Unit C2
- 154 Bedford St
- 113 Colonel Hunt Dr
- 518 Summer St
- 1907 Thayer St
- 70 Groveland St
- 153 Pilgrim St
- 416 Thayer St Unit 416
- 96 Central St
- 1012 Washington St
- 251 Central St
- 206 High St
- 13 Mahoney Cir
- 340 Centre Ave Unit 7
- 181 Central St
- 173 Alden St
- 22 Brookside Rd
- 143 Cranberry Rd
Ask me questions while you tour the home.