73 Walnut St Oxford, MA 01540
Estimated Value: $367,000 - $405,000
3
Beds
1
Bath
1,085
Sq Ft
$362/Sq Ft
Est. Value
About This Home
This home is located at 73 Walnut St, Oxford, MA 01540 and is currently estimated at $393,086, approximately $362 per square foot. 73 Walnut St is a home located in Worcester County with nearby schools including Alfred M Chaffee, Oxford High School, and Clara Barton Elementary School.
Ownership History
Date
Name
Owned For
Owner Type
Purchase Details
Closed on
Nov 14, 2000
Sold by
Beaucage Roger E and Orn Joyce A
Bought by
Orn Craig M and Orn Joyce A
Current Estimated Value
Home Financials for this Owner
Home Financials are based on the most recent Mortgage that was taken out on this home.
Original Mortgage
$65,000
Interest Rate
7.81%
Mortgage Type
Purchase Money Mortgage
Create a Home Valuation Report for This Property
The Home Valuation Report is an in-depth analysis detailing your home's value as well as a comparison with similar homes in the area
Home Values in the Area
Average Home Value in this Area
Purchase History
| Date | Buyer | Sale Price | Title Company |
|---|---|---|---|
| Orn Craig M | $79,900 | -- |
Source: Public Records
Mortgage History
| Date | Status | Borrower | Loan Amount |
|---|---|---|---|
| Open | Orn Craig M | $119,000 | |
| Closed | Orn Craig M | $65,000 |
Source: Public Records
Tax History
| Year | Tax Paid | Tax Assessment Tax Assessment Total Assessment is a certain percentage of the fair market value that is determined by local assessors to be the total taxable value of land and additions on the property. | Land | Improvement |
|---|---|---|---|---|
| 2025 | $44 | $350,200 | $85,000 | $265,200 |
| 2024 | $4,165 | $309,000 | $81,100 | $227,900 |
| 2023 | $3,994 | $292,800 | $77,500 | $215,300 |
| 2022 | $3,754 | $232,300 | $76,300 | $156,000 |
| 2021 | $3,496 | $211,500 | $72,400 | $139,100 |
| 2020 | $3,382 | $203,000 | $72,400 | $130,600 |
| 2019 | $3,212 | $188,600 | $72,400 | $116,200 |
| 2018 | $3,031 | $175,500 | $72,400 | $103,100 |
| 2017 | $2,972 | $176,400 | $69,400 | $107,000 |
| 2016 | $2,986 | $176,400 | $69,400 | $107,000 |
| 2015 | $2,785 | $176,400 | $69,400 | $107,000 |
| 2014 | $2,700 | $180,000 | $67,600 | $112,400 |
Source: Public Records
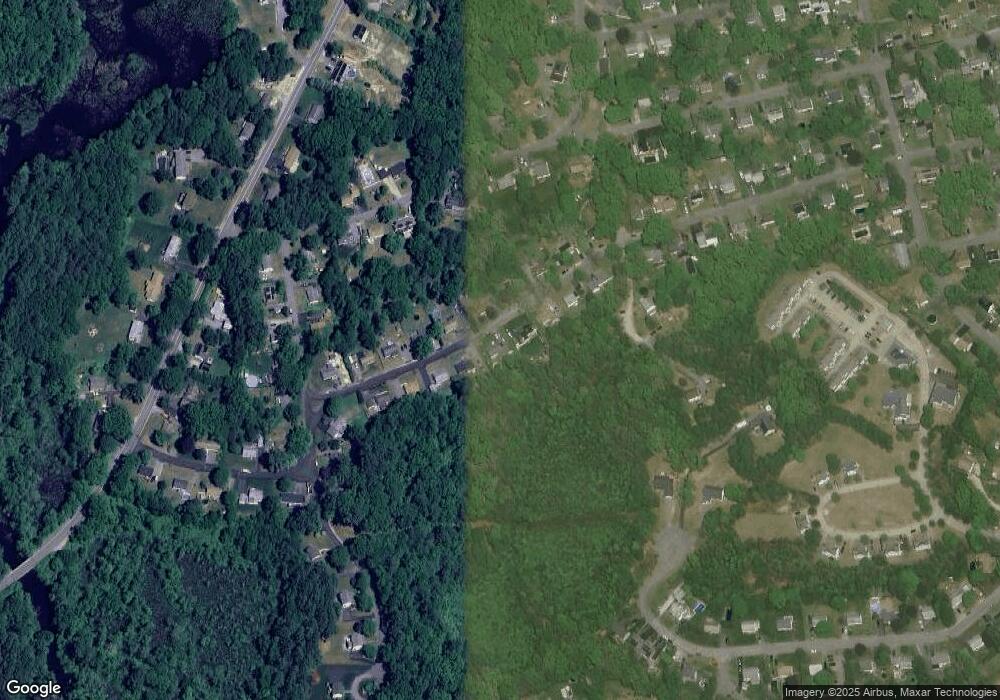
Map
Nearby Homes
Your Personal Tour Guide
Ask me questions while you tour the home.