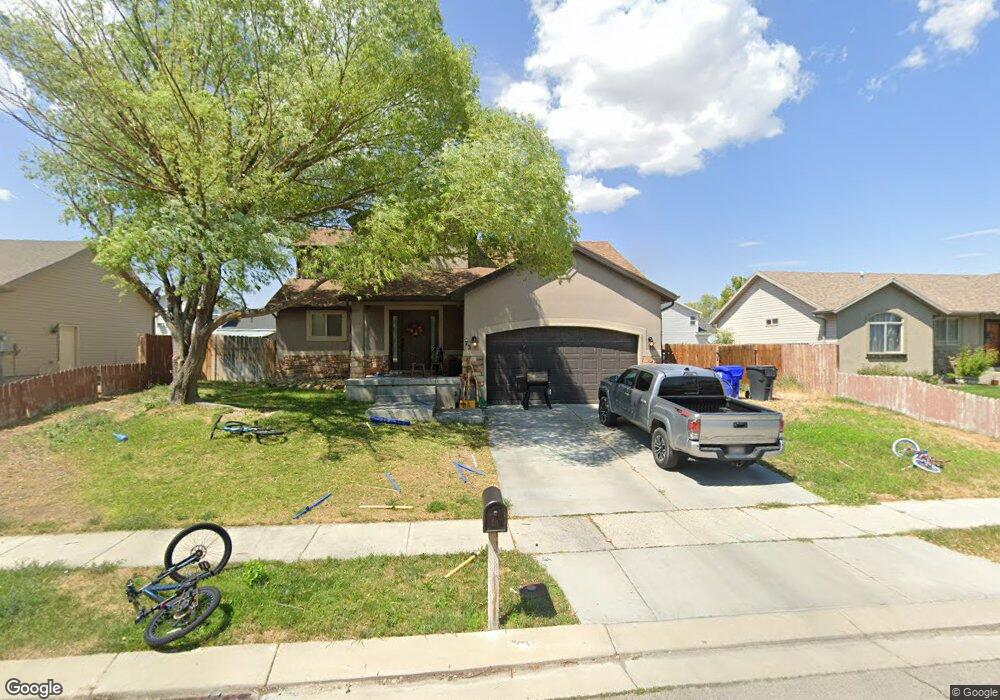
73 Waterhole Way Grantsville, UT 84029
Estimated Value: $420,000 - $450,000
3
Beds
3
Baths
2,375
Sq Ft
$182/Sq Ft
Est. Value
About This Home
This home is located at 73 Waterhole Way, Grantsville, UT 84029 and is currently estimated at $431,552, approximately $181 per square foot. 73 Waterhole Way is a home located in Tooele County with nearby schools including Twenty Wells Elementary, Grantsville Junior High School, and Grantsville High School.
Ownership History
Date
Name
Owned For
Owner Type
Purchase Details
Closed on
May 2, 2017
Sold by
Smith Quinton C and Cartwright Riley R
Bought by
Stice Dalton R
Current Estimated Value
Home Financials for this Owner
Home Financials are based on the most recent Mortgage that was taken out on this home.
Original Mortgage
$220,029
Outstanding Balance
$183,630
Interest Rate
4.23%
Mortgage Type
New Conventional
Estimated Equity
$247,922
Purchase Details
Closed on
Sep 11, 2014
Sold by
Baessler Kelly J and Thompson Kelly J
Bought by
Baessler Trenton M and Baessler Kelly J
Purchase Details
Closed on
Dec 4, 2013
Sold by
Andrus Donald N
Bought by
Thompson Kelly J
Home Financials for this Owner
Home Financials are based on the most recent Mortgage that was taken out on this home.
Original Mortgage
$171,632
Interest Rate
4.08%
Mortgage Type
New Conventional
Create a Home Valuation Report for This Property
The Home Valuation Report is an in-depth analysis detailing your home's value as well as a comparison with similar homes in the area
Home Values in the Area
Average Home Value in this Area
Purchase History
| Date | Buyer | Sale Price | Title Company |
|---|---|---|---|
| Stice Dalton R | -- | Inwest Title | |
| Baessler Trenton M | -- | None Available | |
| Thompson Kelly J | -- | Inwest Title |
Source: Public Records
Mortgage History
| Date | Status | Borrower | Loan Amount |
|---|---|---|---|
| Open | Stice Dalton R | $220,029 | |
| Previous Owner | Thompson Kelly J | $171,632 |
Source: Public Records
Tax History Compared to Growth
Tax History
| Year | Tax Paid | Tax Assessment Tax Assessment Total Assessment is a certain percentage of the fair market value that is determined by local assessors to be the total taxable value of land and additions on the property. | Land | Improvement |
|---|---|---|---|---|
| 2025 | $2,105 | $189,064 | $36,080 | $152,984 |
| 2024 | $2,105 | $171,830 | $36,080 | $135,750 |
| 2023 | $2,105 | $184,628 | $37,840 | $146,788 |
| 2022 | $2,033 | $187,095 | $39,501 | $147,594 |
| 2021 | $1,831 | $137,434 | $31,460 | $105,974 |
| 2020 | $1,789 | $236,340 | $57,200 | $179,140 |
| 2019 | $1,645 | $212,274 | $30,000 | $182,274 |
| 2018 | $1,612 | $196,093 | $30,000 | $166,093 |
| 2017 | $1,404 | $180,994 | $30,000 | $150,994 |
| 2016 | $1,332 | $91,997 | $16,500 | $75,497 |
| 2015 | $1,332 | $91,997 | $0 | $0 |
| 2014 | -- | $79,357 | $0 | $0 |
Source: Public Records
Map
Nearby Homes
- 185 Waterhole Way
- 653 E Main St Unit 45
- 635 Wildrose Dr
- 187 Waterhole Way
- 697 E Main St
- 72 S Mustang Ridge Rd Unit 109
- 699 E Main St
- 600 Clay St
- 601 Clay St
- 799 E Main St
- 113 Utah 112
- 52 East St
- 122 S Liberty Landing Unit 201
- 130 S Liberty Landing Unit 202
- 144 S Liberty Landing Unit 203
- 421 E Stafford St Unit 134
- 178 S Liberty Landing Unit 206
- 123 S Liberty Landing Unit 225
- 131 S Liberty Landing Unit 224
- 145 S Liberty Landing Unit 223
- 83 Waterhole Way
- 83 Waterhole Way Unit 68
- 63 Waterhole Way
- 63 Waterhole Way Unit 66
- 70 Aspen Way
- 60 Aspen Way
- 80 Aspen Way
- 62 Dry Creek Cir
- 93 Waterhole Way
- 62 Waterhole Way
- 53 Waterhole Way
- 53 Waterhole Way Unit 65
- 64 N Dry Creek Cir Unit 13
- 86 N Dry Creek Cir Unit 15
- 74 N Dry Creek Cir
- 92 Aspen Way
- 52 Aspen Way
- 58 Barbed Wire Cir Unit 11
- 58 Barbed Wire Cir
- 99 Waterhole Way