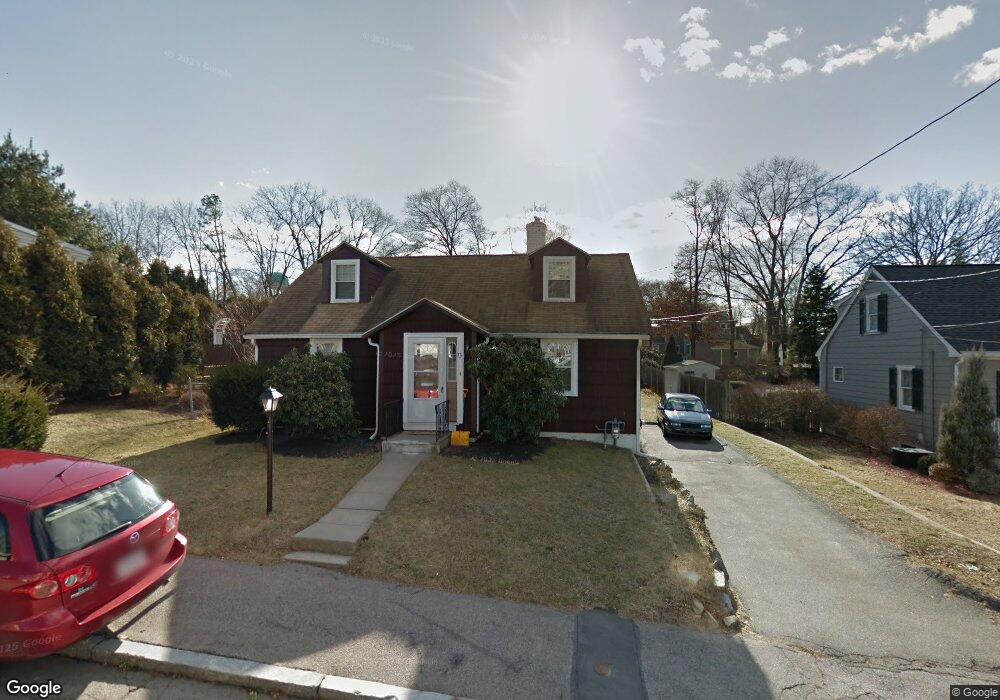
73 Wesson Ave Quincy, MA 02169
Estimated Value: $621,000 - $763,000
3
Beds
1
Bath
1,404
Sq Ft
$469/Sq Ft
Est. Value
About This Home
This home is located at 73 Wesson Ave, Quincy, MA 02169 and is currently estimated at $658,913, approximately $469 per square foot. 73 Wesson Ave is a home located in Norfolk County with nearby schools including South West Middle School, Lincoln-Hancock Community School, and Quincy High School.
Ownership History
Date
Name
Owned For
Owner Type
Purchase Details
Closed on
Jul 18, 2008
Sold by
Buckley Richard F
Bought by
Craig Jennifer A and Craig Norma J
Current Estimated Value
Home Financials for this Owner
Home Financials are based on the most recent Mortgage that was taken out on this home.
Original Mortgage
$150,000
Outstanding Balance
$97,259
Interest Rate
6.17%
Mortgage Type
Purchase Money Mortgage
Estimated Equity
$561,654
Create a Home Valuation Report for This Property
The Home Valuation Report is an in-depth analysis detailing your home's value as well as a comparison with similar homes in the area
Purchase History
| Date | Buyer | Sale Price | Title Company |
|---|---|---|---|
| Craig Jennifer A | $285,000 | -- |
Source: Public Records
Mortgage History
| Date | Status | Borrower | Loan Amount |
|---|---|---|---|
| Open | Craig Jennifer A | $150,000 |
Source: Public Records
Tax History Compared to Growth
Tax History
| Year | Tax Paid | Tax Assessment Tax Assessment Total Assessment is a certain percentage of the fair market value that is determined by local assessors to be the total taxable value of land and additions on the property. | Land | Improvement |
|---|---|---|---|---|
| 2025 | $6,240 | $541,200 | $314,700 | $226,500 |
| 2024 | $5,910 | $524,400 | $299,900 | $224,500 |
| 2023 | $6,128 | $550,600 | $285,800 | $264,800 |
| 2022 | $5,798 | $484,000 | $229,100 | $254,900 |
| 2021 | $5,759 | $474,400 | $229,100 | $245,300 |
| 2020 | $5,806 | $467,100 | $229,100 | $238,000 |
| 2019 | $5,344 | $425,800 | $222,600 | $203,200 |
| 2018 | $5,368 | $402,400 | $206,300 | $196,100 |
| 2017 | $5,128 | $361,900 | $196,600 | $165,300 |
| 2016 | $4,778 | $332,700 | $179,000 | $153,700 |
| 2015 | $4,520 | $309,600 | $169,000 | $140,600 |
| 2014 | $4,268 | $287,200 | $164,500 | $122,700 |
Source: Public Records
Map
Nearby Homes
- 36 Village Dr
- 510 Willard St
- 51 Branch St Unit 2
- 21 Totman St Unit 202
- 21 Totman St Unit 404
- 21 Totman St Unit 309
- 21 Totman St Unit 307
- 21 Totman St Unit 203
- 21 Totman St Unit PH-406
- 21 Totman St Unit PH-401
- 21 Totman St Unit 2
- 347 Centre St
- 57 Buckley St
- 211 Copeland St
- 14 Arthur Ave
- 21 Arthur St
- 91 Garfield St
- 46 Suomi Rd Unit 46
- 46 Suomi Rd
- 64 Garfield St Unit B