73 Wilkins Rd Braintree, MA 02184
East Braintree NeighborhoodEstimated Value: $583,000 - $642,180
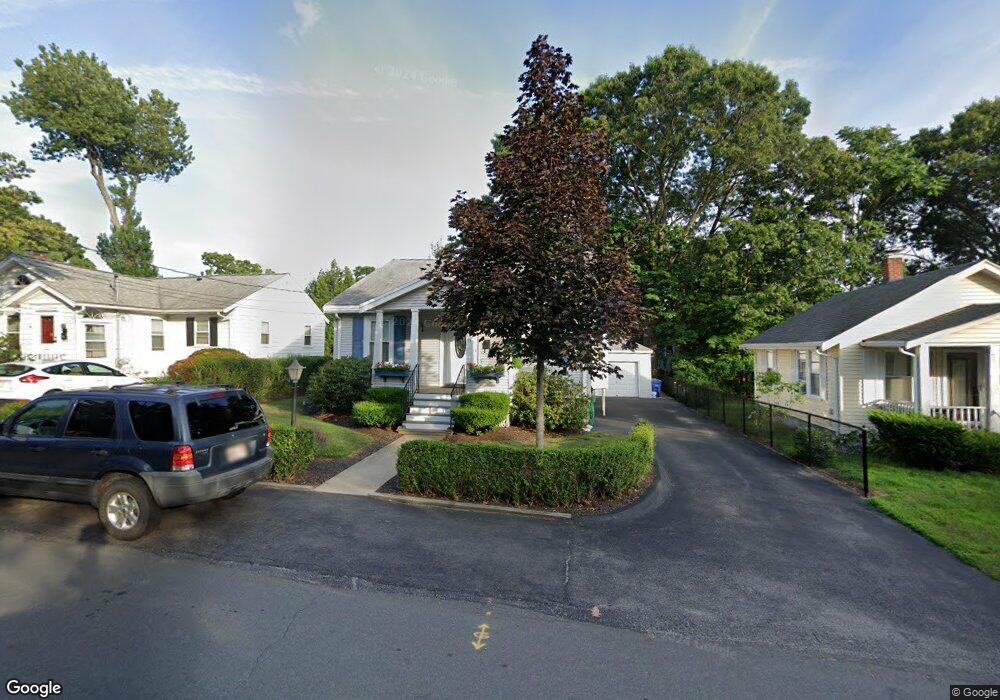
About This Home
This home is located at 73 Wilkins Rd, Braintree, MA 02184 and is currently estimated at $608,545, approximately $501 per square foot. 73 Wilkins Rd is a home located in Norfolk County with nearby schools including Braintree High School, Step Ahead Kindergarten, and Noble Academy.
Ownership History
We collect this data history from publicly available records. To have your information removed, we recommend requesting removal directly through your county’s website.
Purchase Details
Purchase Details
Purchase Details
Home Values in the Area
Average Home Value in this Area
Purchase History
We collect this data history from publicly available records. To have your information removed, we recommend requesting removal directly through your county’s website.
| Date | Buyer | Sale Price | Title Company |
|---|---|---|---|
| -- | -- | ||
| -- | None Available | ||
| -- | -- |
Mortgage History
We collect this data history from publicly available records. To have your information removed, we recommend requesting removal directly through your county’s website.
| Date | Status | Borrower | Loan Amount |
|---|---|---|---|
| Previous Owner | $105,000 | ||
| Previous Owner | $107,000 | ||
| Previous Owner | $72,000 | ||
| Previous Owner | $59,000 |
Tax History
We collect this data history from publicly available records. To have your information removed, we recommend requesting removal directly through your county’s website.
| Year | Tax Paid | Tax Assessment Tax Assessment Total Assessment is a certain percentage of the fair market value that is determined by local assessors to be the total taxable value of land and additions on the property. | Land | Improvement |
|---|---|---|---|---|
| 2025 | $5,794 | $580,600 | $340,000 | $240,600 |
| 2024 | $5,242 | $553,000 | $318,700 | $234,300 |
| 2023 | $4,951 | $507,300 | $280,500 | $226,800 |
| 2022 | $4,794 | $481,800 | $255,000 | $226,800 |
| 2021 | $4,070 | $409,000 | $215,000 | $194,000 |
| 2020 | $3,959 | $401,500 | $215,000 | $186,500 |
| 2019 | $3,817 | $378,300 | $215,000 | $163,300 |
| 2018 | $3,629 | $344,300 | $187,000 | $157,300 |
| 2017 | $3,515 | $327,300 | $170,000 | $157,300 |
| 2016 | $3,301 | $300,600 | $153,000 | $147,600 |
| 2015 | $3,231 | $291,900 | $149,600 | $142,300 |
| 2014 | $3,198 | $280,000 | $137,700 | $142,300 |
Map
- 28 Hillcrest Rd
- 146 Hayward St
- 25 Fairmount Ave
- 7 Somerville Ave
- 16 Cotton Ave
- 296 Commercial St Unit 21
- 24 Hillside Ave
- 30 Skyline Dr Unit 6
- 37 Skyline Dr Unit 11
- 51 Faxon St
- 25 W Howard St Unit G3
- 27 Cindy Ln
- 37 Lantern Ln
- 792 Commercial St
- 27 Sun Valley Dr
- 67 Trefton Dr
- 485 Union St
- 115 Hawthorn Rd
- 200 Falls Blvd Unit B208
- 200 Falls Blvd Unit D110
Ask me questions while you tour the home.