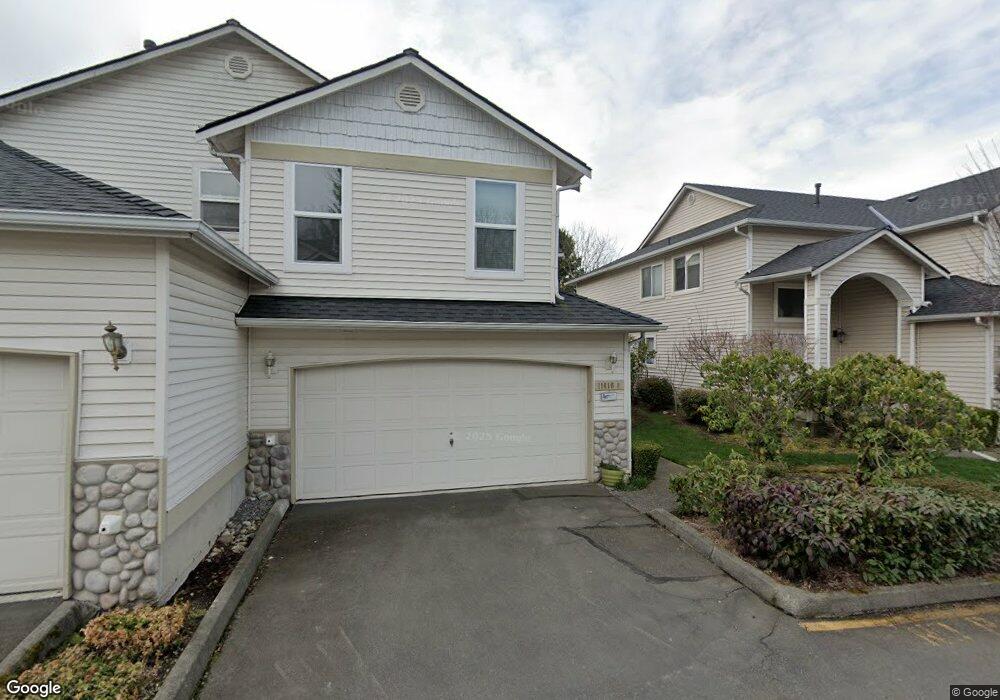
730 112th St SW Unit I2 Everett, WA 98204
Paine Field-Lake Stickney NeighborhoodEstimated Value: $472,000 - $544,000
3
Beds
3
Baths
1,412
Sq Ft
$355/Sq Ft
Est. Value
About This Home
This home is located at 730 112th St SW Unit I2, Everett, WA 98204 and is currently estimated at $501,033, approximately $354 per square foot. 730 112th St SW Unit I2 is a home located in Snohomish County with nearby schools including Olivia Park Elementary School, Voyager Middle School, and Mariner High School.
Ownership History
Date
Name
Owned For
Owner Type
Purchase Details
Closed on
May 21, 2009
Sold by
Elkins Ryan D and Zobrist Leanne M
Bought by
Read Tonya R
Current Estimated Value
Home Financials for this Owner
Home Financials are based on the most recent Mortgage that was taken out on this home.
Original Mortgage
$201,286
Outstanding Balance
$123,792
Interest Rate
4.76%
Mortgage Type
FHA
Estimated Equity
$377,241
Purchase Details
Closed on
Feb 13, 2004
Sold by
Zuch Anna J
Bought by
Elkins Ryan D and Zobrist Leanne M
Home Financials for this Owner
Home Financials are based on the most recent Mortgage that was taken out on this home.
Original Mortgage
$172,000
Interest Rate
5.62%
Mortgage Type
VA
Purchase Details
Closed on
Jan 30, 2004
Sold by
Zuch Frank M
Bought by
Zuch Anna J
Home Financials for this Owner
Home Financials are based on the most recent Mortgage that was taken out on this home.
Original Mortgage
$172,000
Interest Rate
5.62%
Mortgage Type
VA
Purchase Details
Closed on
Feb 23, 1998
Sold by
Zuch Anna J
Bought by
Zuch Anna J and Zuch Frank M
Create a Home Valuation Report for This Property
The Home Valuation Report is an in-depth analysis detailing your home's value as well as a comparison with similar homes in the area
Home Values in the Area
Average Home Value in this Area
Purchase History
| Date | Buyer | Sale Price | Title Company |
|---|---|---|---|
| Read Tonya R | $205,000 | Northpoint Escrow & Title Ll | |
| Elkins Ryan D | $172,000 | Pnwt | |
| Zuch Anna J | -- | Pnwt | |
| Zuch Anna J | -- | -- |
Source: Public Records
Mortgage History
| Date | Status | Borrower | Loan Amount |
|---|---|---|---|
| Open | Read Tonya R | $201,286 | |
| Previous Owner | Elkins Ryan D | $172,000 |
Source: Public Records
Tax History
| Year | Tax Paid | Tax Assessment Tax Assessment Total Assessment is a certain percentage of the fair market value that is determined by local assessors to be the total taxable value of land and additions on the property. | Land | Improvement |
|---|---|---|---|---|
| 2026 | $4,055 | $512,000 | $70,000 | $442,000 |
| 2025 | $3,874 | $469,500 | $66,500 | $403,000 |
| 2024 | $3,874 | $451,500 | $64,500 | $387,000 |
| 2023 | $3,394 | $410,500 | $56,500 | $354,000 |
| 2022 | $3,334 | $342,000 | $50,000 | $292,000 |
| 2020 | $3,103 | $312,000 | $46,500 | $265,500 |
| 2019 | $2,592 | $260,000 | $39,000 | $221,000 |
| 2018 | $2,736 | $240,000 | $37,500 | $202,500 |
| 2017 | $2,286 | $204,000 | $34,000 | $170,000 |
| 2016 | $2,234 | $198,000 | $32,500 | $165,500 |
| 2015 | $1,832 | $147,000 | $30,500 | $116,500 |
| 2013 | $1,743 | $131,000 | $30,500 | $100,500 |
Source: Public Records
Map
Nearby Homes
- 730 112th St SW Unit I4
- 730 112th St SW Unit F6
- 725 115th St SW Unit BB204
- 727 114th St SW Unit X201
- 723 114th St SW Unit Y203
- 729 112th St SW Unit G-1
- 11121 7th Place W Unit D
- 11017 7th Place W Unit 6A
- 11031 6th Ave W
- 900 116th St SW
- 1131 115th St SW Unit J3
- 1131 115th St SW Unit I4
- 414 116th Place SW
- 11500 Meridian Ave S Unit 91
- 11500 Meridian Ave S Unit 49
- 1223 118th Place SW Unit 90
- 412 Center Rd Unit A1
- 11527 Highway 99 Unit A202
- 11527 Highway 99 Unit A105
- 11527 Highway 99 Unit B103
- 730 112th St SW
- 730 112th St SW Unit I5
- 730 112th St SW Unit I3
- 730 112th St SW Unit I1
- 730 112th St SW Unit H6
- 730 112th St SW Unit H5
- 730 112th St SW Unit H4
- 730 112th St SW Unit H2
- 730 112th St SW Unit H1
- 730 112th St SW Unit G305
- 730 112th St SW Unit G304
- 730 112th St SW Unit G302
- 730 112th St SW Unit G206
- 730 112th St SW Unit G204
- 730 112th St SW Unit G203
- 730 112th St SW Unit G202
- 730 112th St SW Unit G201
- 730 112th St SW Unit G105
Your Personal Tour Guide
Ask me questions while you tour the home.