Estimated Value: $576,724 - $686,000
4
Beds
4
Baths
3,516
Sq Ft
$178/Sq Ft
Est. Value
About This Home
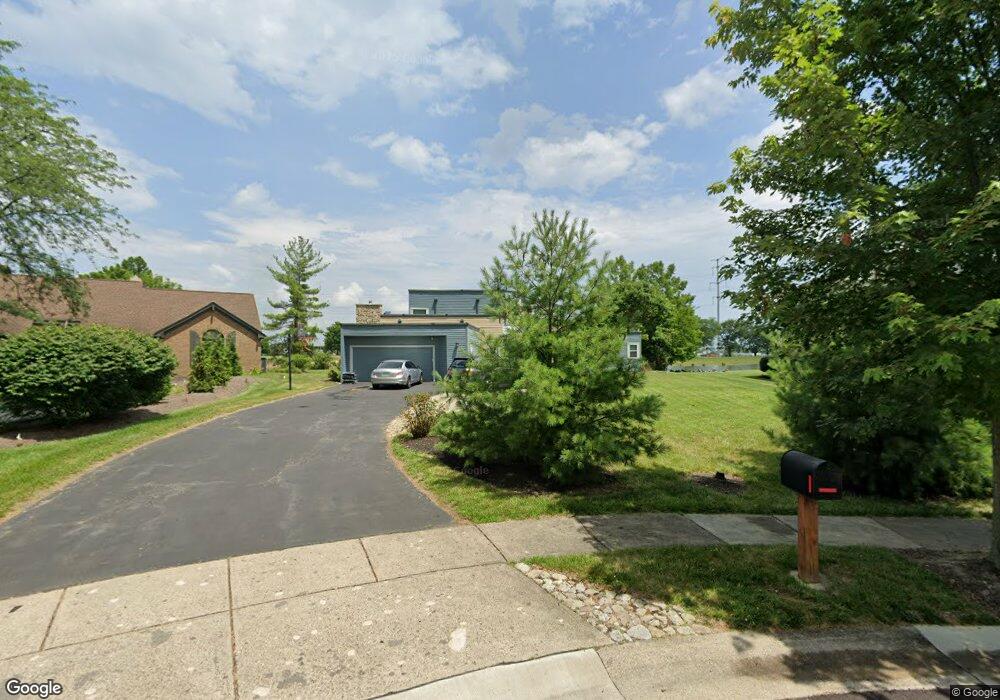
This home is located at 730 Eagle View Ct, Mason, OH 45040 and is currently estimated at $624,431, approximately $177 per square foot. 730 Eagle View Ct is a home located in Warren County with nearby schools including Mason Intermediate Elementary School, Mason Middle School, and William Mason High School.
Ownership History
Date
Name
Owned For
Owner Type
Purchase Details
Closed on
Jan 6, 2014
Sold by
Reace Ltd
Bought by
Rose Gregory and Rose Shumei
Current Estimated Value
Home Financials for this Owner
Home Financials are based on the most recent Mortgage that was taken out on this home.
Original Mortgage
$160,000
Outstanding Balance
$119,492
Interest Rate
4.42%
Mortgage Type
Future Advance Clause Open End Mortgage
Estimated Equity
$504,939
Purchase Details
Closed on
May 2, 2012
Sold by
Keoz Ltd
Bought by
Reace Ltd
Purchase Details
Closed on
Nov 16, 2004
Sold by
Monaco Equities Ltd
Bought by
Keoz Ltd
Purchase Details
Closed on
Mar 9, 1984
Sold by
Kings Island Real Estate
Bought by
Broshear Properties & Inc.
Purchase Details
Closed on
Dec 21, 1983
Sold by
Kings Island Real Estate
Bought by
Kings Island Real Estate
Create a Home Valuation Report for This Property
The Home Valuation Report is an in-depth analysis detailing your home's value as well as a comparison with similar homes in the area
Home Values in the Area
Average Home Value in this Area
Purchase History
| Date | Buyer | Sale Price | Title Company |
|---|---|---|---|
| Rose Gregory | $260,000 | None Available | |
| Reace Ltd | -- | None Available | |
| Keoz Ltd | $241,000 | -- | |
| Broshear Properties & Inc. | $37,500 | -- | |
| Kings Island Real Estate | -- | -- |
Source: Public Records
Mortgage History
| Date | Status | Borrower | Loan Amount |
|---|---|---|---|
| Open | Rose Gregory | $160,000 |
Source: Public Records
Tax History Compared to Growth
Tax History
| Year | Tax Paid | Tax Assessment Tax Assessment Total Assessment is a certain percentage of the fair market value that is determined by local assessors to be the total taxable value of land and additions on the property. | Land | Improvement |
|---|---|---|---|---|
| 2024 | $6,693 | $164,840 | $38,500 | $126,340 |
| 2023 | $5,872 | $122,146 | $21,175 | $100,971 |
| 2022 | $5,796 | $122,147 | $21,175 | $100,972 |
| 2021 | $5,491 | $122,147 | $21,175 | $100,972 |
| 2020 | $5,806 | $110,681 | $19,250 | $91,431 |
| 2019 | $5,338 | $110,681 | $19,250 | $91,431 |
| 2018 | $5,356 | $110,681 | $19,250 | $91,431 |
| 2017 | $4,920 | $94,903 | $16,765 | $78,138 |
| 2016 | $5,068 | $94,903 | $16,765 | $78,138 |
| 2015 | $5,078 | $94,903 | $16,765 | $78,138 |
| 2014 | $5,431 | $92,140 | $16,280 | $75,860 |
| 2013 | $5,443 | $108,980 | $19,250 | $89,730 |
Source: Public Records
Map
Nearby Homes
- 602 Bunker Ln
- 550 Maple Ln
- 618 Bunker Ln
- 3634 Pebble Creek Ct
- 6510 Prestwick Ct
- 420 Walnut Ln
- 3905 Brantford Way Unit B3905
- 6668 Pondfield Ln
- 6768 Pondfield Ln Unit 271E
- 6764 Pondfield Ln
- 5399 Country Ridge Dr
- 5276 Bay Pointe Dr
- 6674 Villager Place Unit 153D
- 305 Bainbridge Ct Unit 14
- 5212 Bay Pointe Dr
- 5533 Cox-Smith Rd
- 5523 Cox-Smith Rd
- 5513 Cox-Smith Rd
- 6725 Ridgefield Ct Unit 147F
- 5493 Cox-Smith Rd
- 730 Eagleview Ct
- 721 Eagleview Ct
- 728 Eagleview Ct
- 726 Eagle View Ct
- 719 Eagleview Ct
- 726 Eagleview Ct
- 719 Eagle View Ct
- 716 Eagleview Ct
- 717 Eagleview Ct
- 724 Eagle View Ct
- 724 Eagleview Ct
- 718 Eagleview Ct
- 715 Eagleview Ct
- 715 Eagle View Ct
- 718 Eagle View Ct
- 722 Eagleview Ct
- 720 Eagleview Ct
- 713 Eagle View Ct
- 714 Eagleview Ct
- 713 Eagleview Ct