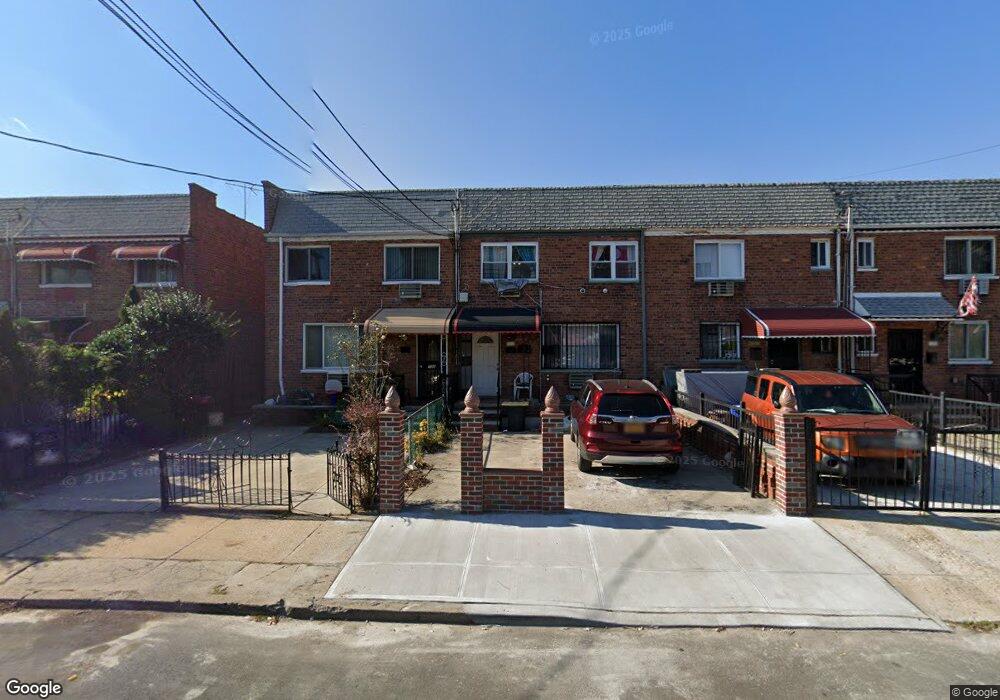
730 Hemlock St Unit 2 Brooklyn, NY 11208
East New York NeighborhoodEstimated Value: $657,908 - $1,012,000
3
Beds
1
Bath
960
Sq Ft
$920/Sq Ft
Est. Value
About This Home
This home is located at 730 Hemlock St Unit 2, Brooklyn, NY 11208 and is currently estimated at $883,227, approximately $920 per square foot. 730 Hemlock St Unit 2 is a home located in Kings County with nearby schools including P.S. 159 Isaac Pitkin, Brooklyn Scholars Charter School, and Achievement First Aspire Charter.
Ownership History
Date
Name
Owned For
Owner Type
Purchase Details
Closed on
Nov 21, 2023
Sold by
Nevins Juliet M
Bought by
Juliet M Nevins Revocable Trust and Nevins
Current Estimated Value
Purchase Details
Closed on
Oct 14, 2022
Sold by
Henry Michelle J and Nevins Juliet M
Bought by
Nevins Juliet M
Purchase Details
Closed on
Mar 16, 2013
Sold by
Henry Junior
Bought by
Henry Michelle J and Nevins Juliet M
Purchase Details
Closed on
Sep 9, 2003
Sold by
Nevins Pearl
Bought by
Henry Junior
Purchase Details
Closed on
Apr 14, 1999
Sold by
Nevins Juliet
Bought by
Nevins Pearl
Purchase Details
Closed on
Sep 19, 1996
Sold by
Nevins Pearl
Bought by
Nevins Juliet
Create a Home Valuation Report for This Property
The Home Valuation Report is an in-depth analysis detailing your home's value as well as a comparison with similar homes in the area
Home Values in the Area
Average Home Value in this Area
Purchase History
| Date | Buyer | Sale Price | Title Company |
|---|---|---|---|
| Juliet M Nevins Revocable Trust | -- | -- | |
| Juliet M Nevins Revocable Trust | -- | -- | |
| Juliet M Nevins Revocable Trust | -- | -- | |
| Nevins Juliet M | -- | -- | |
| Nevins Juliet M | -- | -- | |
| Nevins Juliet M | -- | -- | |
| Henry Michelle J | $24,000 | -- | |
| Henry Michelle J | $24,000 | -- | |
| Henry Junior | -- | -- | |
| Henry Junior | -- | -- | |
| Nevins Pearl | -- | Commonwealth Land Title Ins | |
| Nevins Pearl | -- | Commonwealth Land Title Ins | |
| Nevins Juliet | -- | Commonwealth Land Title Ins | |
| Nevins Juliet | -- | Commonwealth Land Title Ins |
Source: Public Records
Tax History
| Year | Tax Paid | Tax Assessment Tax Assessment Total Assessment is a certain percentage of the fair market value that is determined by local assessors to be the total taxable value of land and additions on the property. | Land | Improvement |
|---|---|---|---|---|
| 2025 | $6,230 | $39,600 | $12,540 | $27,060 |
| 2024 | $6,230 | $46,620 | $12,540 | $34,080 |
| 2023 | $6,252 | $43,800 | $12,540 | $31,260 |
| 2022 | $5,797 | $41,880 | $12,540 | $29,340 |
| 2021 | $5,766 | $34,200 | $12,540 | $21,660 |
| 2020 | $2,704 | $34,440 | $12,540 | $21,900 |
| 2019 | $5,407 | $31,740 | $12,540 | $19,200 |
| 2018 | $5,229 | $25,653 | $10,173 | $15,480 |
| 2017 | $4,933 | $24,201 | $9,937 | $14,264 |
| 2016 | $4,564 | $22,832 | $10,870 | $11,962 |
| 2015 | $2,806 | $21,540 | $10,980 | $10,560 |
| 2014 | $2,806 | $21,540 | $10,980 | $10,560 |
Source: Public Records
Map
Nearby Homes
- 600 Pine St
- 1394 Dumont Ave
- 661 Euclid Ave
- 778 Lincoln Ave
- 667 Hemlock St
- 1371-1373 Dumont Ave
- 727 Euclid Ave
- 644 Autumn Ave
- 1323 Sutter Ave
- 551 Euclid Ave Unit 4
- 1128 Belmont Ave
- 1059 Belmont Ave
- 705 Eldert Ln Unit 709
- 1460 Sutter Ave
- 555 Hemlock St
- 430 Pine St
- 1472 Blake Ave
- 1474 Blake Ave
- 365 Forbell St
- 865 Euclid Ave
- 730 Hemlock St
- 728 Hemlock St
- 734 Hemlock St
- 726 Hemlock St
- 736 Hemlock St
- 724 Hemlock St
- 738 Hemlock St
- 720 Hemlock St
- 740 Hemlock St
- 718 Hemlock St
- 687 Crescent St
- 689 Crescent St
- 685 Crescent St
- 742 Hemlock St
- 683 Crescent St
- 691 Crescent St
- 716 Hemlock St
- 697 Crescent St
- 679 Crescent St
- 746 Hemlock St
Your Personal Tour Guide
Ask me questions while you tour the home.