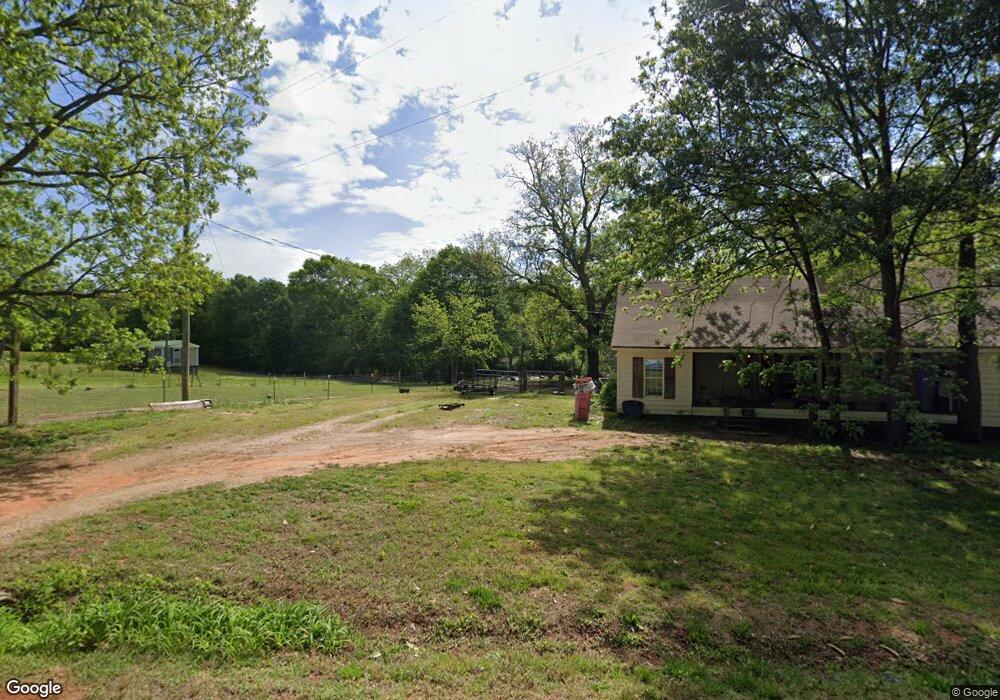
730 Holloway Rd Danielsville, GA 30633
Estimated Value: $122,460 - $235,000
2
Beds
1
Bath
1,442
Sq Ft
$134/Sq Ft
Est. Value
About This Home
This home is located at 730 Holloway Rd, Danielsville, GA 30633 and is currently estimated at $193,865, approximately $134 per square foot. 730 Holloway Rd is a home located in Madison County with nearby schools including Madison County High School.
Ownership History
Date
Name
Owned For
Owner Type
Purchase Details
Closed on
Mar 7, 2019
Sold by
Johnson Jimmy R
Bought by
Laflam Shane M and Laflam Heather
Current Estimated Value
Home Financials for this Owner
Home Financials are based on the most recent Mortgage that was taken out on this home.
Original Mortgage
$75,291
Outstanding Balance
$66,194
Interest Rate
4.4%
Mortgage Type
FHA
Estimated Equity
$127,671
Purchase Details
Closed on
Aug 31, 2017
Sold by
Mello Melody
Bought by
Johnson Jimmy Ray and Johnson Mildred R
Purchase Details
Closed on
Apr 24, 2009
Sold by
Woodall William H
Bought by
Mello Melody
Purchase Details
Closed on
Jan 27, 2005
Sold by
Phillips Anthony G
Bought by
Woodall William H
Purchase Details
Closed on
Sep 30, 1997
Sold by
Bridges Lois H
Bought by
Wall Samuel W
Purchase Details
Closed on
Jan 1, 1950
Bought by
Bridges Lois H
Create a Home Valuation Report for This Property
The Home Valuation Report is an in-depth analysis detailing your home's value as well as a comparison with similar homes in the area
Home Values in the Area
Average Home Value in this Area
Purchase History
| Date | Buyer | Sale Price | Title Company |
|---|---|---|---|
| Laflam Shane M | $26,500 | -- | |
| Johnson Jimmy Ray | $35,000 | -- | |
| Mello Melody | -- | -- | |
| Woodall William H | $45,000 | -- | |
| Phillips Anthony G | $35,000 | -- | |
| Wall Samuel W | $22,500 | -- | |
| Bridges Lois H | -- | -- |
Source: Public Records
Mortgage History
| Date | Status | Borrower | Loan Amount |
|---|---|---|---|
| Open | Laflam Shane M | $75,291 |
Source: Public Records
Tax History Compared to Growth
Tax History
| Year | Tax Paid | Tax Assessment Tax Assessment Total Assessment is a certain percentage of the fair market value that is determined by local assessors to be the total taxable value of land and additions on the property. | Land | Improvement |
|---|---|---|---|---|
| 2024 | $528 | $22,294 | $13,270 | $9,024 |
| 2023 | $596 | $19,530 | $11,058 | $8,472 |
| 2022 | $365 | $15,251 | $7,603 | $7,648 |
| 2021 | $354 | $13,595 | $7,603 | $5,992 |
| 2020 | $322 | $12,490 | $6,498 | $5,992 |
| 2019 | $555 | $17,833 | $11,953 | $5,880 |
| 2018 | $437 | $16,600 | $10,936 | $5,664 |
| 2017 | $450 | $15,612 | $10,172 | $5,440 |
| 2016 | $427 | $14,868 | $10,172 | $4,696 |
| 2015 | $427 | $14,868 | $10,172 | $4,696 |
| 2014 | $436 | $15,077 | $10,493 | $4,584 |
| 2013 | -- | $15,077 | $10,493 | $4,584 |
Source: Public Records
Map
Nearby Homes
- 0 Carey Ford Rd Unit 10495957
- 266 Water Oak Rd
- 450 Stagecoach Way
- 0 Carey-Ford Rd
- 00 Georgia 174 Unit 1
- 795 E Jones Chapel Rd
- 0 Dickson Dr Unit 416392
- 0 Dickson Dr Unit 7594620
- 0 Dickson Dr Unit 23800701
- 0 Dickson Dr Unit 10539867
- 955 Collins Dudley Rd
- 1344 Jim Grizzle Rd
- 1112 Reno Rd
- 352 Jim Grizzle Rd
- 318 Jim Grizzle Rd
- 0 Kirk Langford Rd Unit 7671084
- 0 Kirk Langford Rd Unit 10630817
- 222 Reno Rd
- 1745 Hannah Creek Church Rd
- 417 Cheek Pulliam Rd
- 676 Holloway Rd
- 653 Holloway Rd
- 802 Holloway Rd
- 773 Holloway Rd
- 934 Holloway Rd
- 483 Holloway Rd
- 526 Charles Bruce Rd
- 6585 Highway 29 N
- 570 van Manley Rd
- 533 Long Peeples Rd
- 475 van Manley Rd
- 6761 Highway 29 N
- 304 Holloway Rd
- 395 van Manley Rd
- 00 Long Peeples Rd
- 6517 Highway 29 N
- 422 Charles Bruce Rd
- 6590 Hwy 29n
- 6590 U S 29
- 6590 Highway 29 N