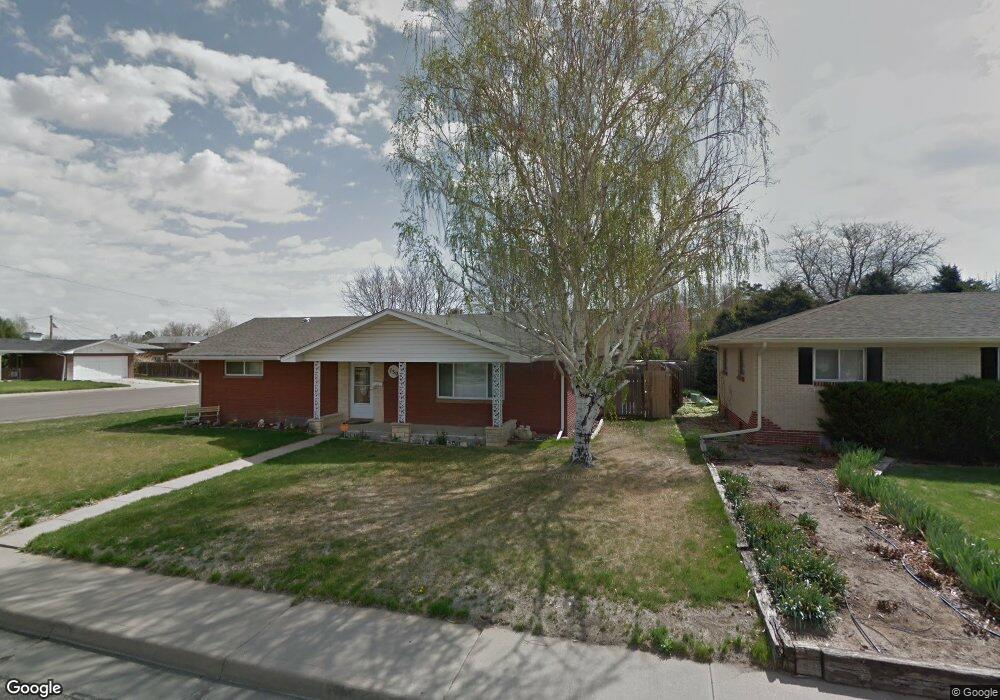
730 Lane St Fort Morgan, CO 80701
Estimated Value: $350,000 - $440,000
5
Beds
2
Baths
2,782
Sq Ft
$136/Sq Ft
Est. Value
About This Home
This home is located at 730 Lane St, Fort Morgan, CO 80701 and is currently estimated at $377,891, approximately $135 per square foot. 730 Lane St is a home located in Morgan County with nearby schools including Fort Morgan High School, Trinity Lutheran School, and Lighthouse Seventh-day Adventist Christian School.
Ownership History
Date
Name
Owned For
Owner Type
Purchase Details
Closed on
Jun 28, 2024
Sold by
Skinner Marilyn K
Bought by
Francone Kyle D and Francone Meghan C
Current Estimated Value
Purchase Details
Closed on
Sep 27, 2007
Sold by
Gibson Dwaine and Gibson Katharine E
Bought by
Lebsock Lisa L
Home Financials for this Owner
Home Financials are based on the most recent Mortgage that was taken out on this home.
Original Mortgage
$157,108
Interest Rate
6.66%
Mortgage Type
FHA
Create a Home Valuation Report for This Property
The Home Valuation Report is an in-depth analysis detailing your home's value as well as a comparison with similar homes in the area
Home Values in the Area
Average Home Value in this Area
Purchase History
| Date | Buyer | Sale Price | Title Company |
|---|---|---|---|
| Francone Kyle D | $170,000 | None Listed On Document | |
| Lebsock Lisa L | $159,575 | None Available |
Source: Public Records
Mortgage History
| Date | Status | Borrower | Loan Amount |
|---|---|---|---|
| Previous Owner | Lebsock Lisa L | $157,108 |
Source: Public Records
Tax History Compared to Growth
Tax History
| Year | Tax Paid | Tax Assessment Tax Assessment Total Assessment is a certain percentage of the fair market value that is determined by local assessors to be the total taxable value of land and additions on the property. | Land | Improvement |
|---|---|---|---|---|
| 2024 | $1,753 | $21,900 | $2,550 | $19,350 |
| 2023 | $1,753 | $25,580 | $2,980 | $22,600 |
| 2022 | $1,420 | $17,320 | $2,920 | $14,400 |
| 2021 | $1,461 | $17,810 | $3,000 | $14,810 |
| 2020 | $1,351 | $16,020 | $2,860 | $13,160 |
| 2019 | $1,353 | $16,020 | $2,860 | $13,160 |
| 2018 | $1,102 | $12,860 | $2,380 | $10,480 |
| 2017 | $1,103 | $12,860 | $2,380 | $10,480 |
| 2016 | $1,105 | $12,760 | $2,870 | $9,890 |
| 2015 | $1,089 | $12,760 | $2,870 | $9,890 |
| 2014 | $1,065 | $12,170 | $2,550 | $9,620 |
| 2013 | -- | $12,170 | $2,550 | $9,620 |
Source: Public Records
Map
Nearby Homes