730 Main St Hingham, MA 02043
Estimated Value: $1,855,000 - $2,090,000
5
Beds
2
Baths
2,380
Sq Ft
$819/Sq Ft
Est. Value
About This Home
This home is located at 730 Main St, Hingham, MA 02043 and is currently estimated at $1,949,662, approximately $819 per square foot. 730 Main St is a home located in Plymouth County with nearby schools including South Elementary School, Hingham Middle School, and Hingham High School.
Ownership History
Date
Name
Owned For
Owner Type
Purchase Details
Closed on
Nov 25, 2020
Sold by
730 Main Street Rt
Bought by
Williams Thomas M and Williams Brie P
Current Estimated Value
Purchase Details
Closed on
Aug 23, 2010
Sold by
Williams Thomas M and Williams Brie P
Bought by
730 Main Rt and Williams Thomas M
Purchase Details
Closed on
Dec 1, 2008
Sold by
Wolffer James T and Wolffer Judith
Bought by
Williams Thomas M and Williams Brie P
Purchase Details
Closed on
Mar 5, 2007
Sold by
Thomas Hastings Prop I
Bought by
Wolffer James T and Wolffer Judith
Purchase Details
Closed on
Aug 11, 2006
Sold by
Biviano Lt and Biviano Anne E
Bought by
Thomas Hastings Prop I
Create a Home Valuation Report for This Property
The Home Valuation Report is an in-depth analysis detailing your home's value as well as a comparison with similar homes in the area
Purchase History
| Date | Buyer | Sale Price | Title Company |
|---|---|---|---|
| Williams Thomas M | -- | None Available | |
| 730 Main Rt | -- | -- | |
| Williams Thomas M | $650,000 | -- | |
| Wolffer James T | $626,000 | -- | |
| Thomas Hastings Prop I | $800,000 | -- |
Source: Public Records
Mortgage History
| Date | Status | Borrower | Loan Amount |
|---|---|---|---|
| Previous Owner | Thomas Hastings Prop I | $465,700 | |
| Previous Owner | Thomas Hastings Prop I | $100,000 | |
| Previous Owner | Thomas Hastings Prop I | $500,000 |
Source: Public Records
Tax History
| Year | Tax Paid | Tax Assessment Tax Assessment Total Assessment is a certain percentage of the fair market value that is determined by local assessors to be the total taxable value of land and additions on the property. | Land | Improvement |
|---|---|---|---|---|
| 2025 | $20,100 | $1,880,300 | $771,700 | $1,108,600 |
| 2024 | $20,049 | $1,847,800 | $771,700 | $1,076,100 |
| 2023 | $18,130 | $1,813,000 | $771,700 | $1,041,300 |
| 2022 | $17,628 | $1,524,900 | $665,000 | $859,900 |
| 2021 | $17,583 | $1,490,100 | $665,000 | $825,100 |
| 2020 | $16,842 | $1,460,700 | $665,000 | $795,700 |
| 2019 | $17,082 | $1,446,400 | $665,000 | $781,400 |
| 2018 | $16,744 | $1,422,600 | $665,000 | $757,600 |
| 2017 | $16,473 | $1,344,700 | $664,900 | $679,800 |
| 2016 | $16,398 | $1,312,900 | $633,100 | $679,800 |
| 2015 | $16,319 | $1,302,400 | $622,600 | $679,800 |
Source: Public Records
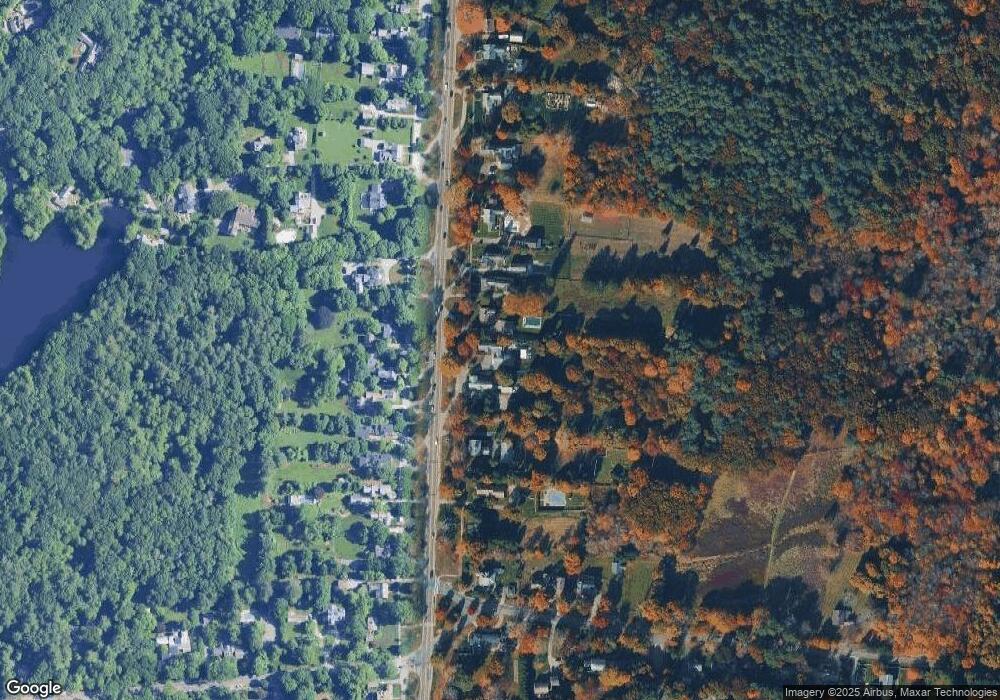
Map
Nearby Homes
Your Personal Tour Guide
Ask me questions while you tour the home.