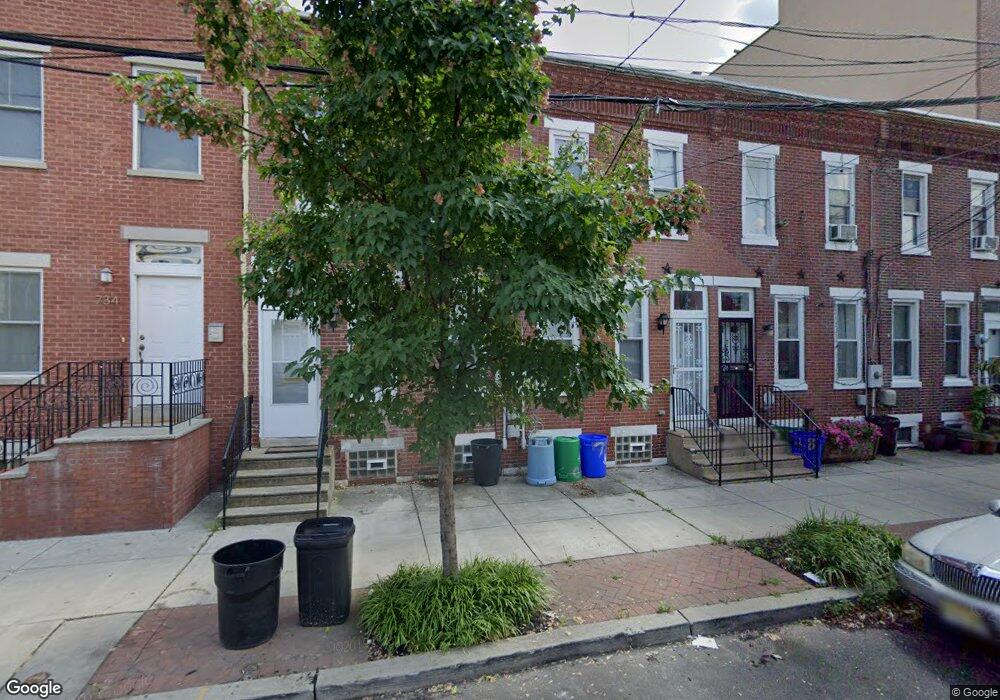
730 New St Camden, NJ 08103
Lanning Square NeighborhoodEstimated Value: $107,602 - $186,000
Studio
--
Bath
1,024
Sq Ft
$144/Sq Ft
Est. Value
About This Home
This home is located at 730 New St, Camden, NJ 08103 and is currently estimated at $147,901, approximately $144 per square foot. 730 New St is a home located in Camden County with nearby schools including Camden High School, Hope Community Charter School, and Leap Academy University Charter School.
Ownership History
Date
Name
Owned For
Owner Type
Purchase Details
Closed on
Jul 21, 1998
Sold by
Roberts Lisa
Bought by
Brown Natasha
Current Estimated Value
Home Financials for this Owner
Home Financials are based on the most recent Mortgage that was taken out on this home.
Original Mortgage
$36,000
Outstanding Balance
$7,329
Interest Rate
6.94%
Estimated Equity
$140,572
Purchase Details
Closed on
Sep 30, 1994
Sold by
Neighborhood Housing Ser
Bought by
Roberts Lisa
Home Financials for this Owner
Home Financials are based on the most recent Mortgage that was taken out on this home.
Original Mortgage
$33,000
Interest Rate
8.55%
Create a Home Valuation Report for This Property
The Home Valuation Report is an in-depth analysis detailing your home's value as well as a comparison with similar homes in the area
Home Values in the Area
Average Home Value in this Area
Purchase History
| Date | Buyer | Sale Price | Title Company |
|---|---|---|---|
| Brown Natasha | $36,000 | -- | |
| Roberts Lisa | $35,000 | -- |
Source: Public Records
Mortgage History
| Date | Status | Borrower | Loan Amount |
|---|---|---|---|
| Open | Brown Natasha | $36,000 | |
| Previous Owner | Roberts Lisa | $33,000 |
Source: Public Records
Tax History
| Year | Tax Paid | Tax Assessment Tax Assessment Total Assessment is a certain percentage of the fair market value that is determined by local assessors to be the total taxable value of land and additions on the property. | Land | Improvement |
|---|---|---|---|---|
| 2025 | $1,888 | $53,300 | $6,100 | $47,200 |
| 2024 | $1,826 | $53,300 | $6,100 | $47,200 |
| 2023 | $1,826 | $53,300 | $6,100 | $47,200 |
| 2022 | $1,791 | $53,300 | $6,100 | $47,200 |
| 2021 | $1,785 | $53,300 | $6,100 | $47,200 |
| 2020 | $1,695 | $53,300 | $6,100 | $47,200 |
| 2019 | $1,623 | $53,300 | $6,100 | $47,200 |
| 2018 | $1,614 | $53,300 | $6,100 | $47,200 |
| 2017 | $1,575 | $53,300 | $6,100 | $47,200 |
| 2016 | $1,525 | $53,300 | $6,100 | $47,200 |
| 2015 | $1,468 | $53,300 | $6,100 | $47,200 |
| 2014 | $1,433 | $53,300 | $6,100 | $47,200 |
Source: Public Records
Map
Nearby Homes
- 711 Berkley St
- 601 Berkley St
- 806 Princeton Ave
- 576 Washington St
- 803 Princeton Ave
- 565 Line St
- 824 S 8th St
- 579 Pine St
- 724 Spruce St
- 718 Spruce St
- 636 Spruce St
- 836 Haddon Ave
- 974 S 8th St
- 436 Line St
- 759 Mount Vernon St
- 764 Mount Vernon St
- 425 Beckett St
- 1153 Cooper St
- 507 S 4th St
- 321 Washington St
Your Personal Tour Guide
Ask me questions while you tour the home.