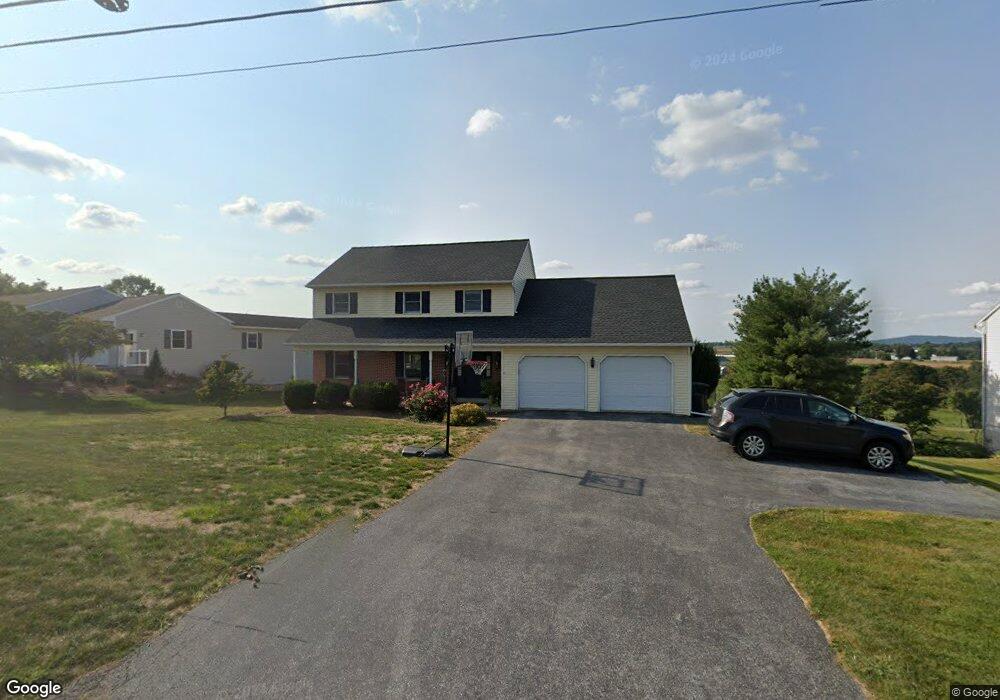
730 Orchard Rd Manheim, PA 17545
Estimated Value: $407,458 - $487,000
3
Beds
3
Baths
1,888
Sq Ft
$243/Sq Ft
Est. Value
About This Home
This home is located at 730 Orchard Rd, Manheim, PA 17545 and is currently estimated at $458,365, approximately $242 per square foot. 730 Orchard Rd is a home located in Lancaster County with nearby schools including Manheim Central Senior High School, Manheim Christian Day School, and Sporting Hill Christian School.
Ownership History
Date
Name
Owned For
Owner Type
Purchase Details
Closed on
May 29, 2015
Sold by
Brubaker James and Brubaker Shirley A
Bought by
Ginder Bradley R and Ginder Kari M
Current Estimated Value
Home Financials for this Owner
Home Financials are based on the most recent Mortgage that was taken out on this home.
Original Mortgage
$232,655
Outstanding Balance
$179,552
Interest Rate
3.65%
Mortgage Type
New Conventional
Estimated Equity
$278,813
Create a Home Valuation Report for This Property
The Home Valuation Report is an in-depth analysis detailing your home's value as well as a comparison with similar homes in the area
Home Values in the Area
Average Home Value in this Area
Purchase History
| Date | Buyer | Sale Price | Title Company |
|---|---|---|---|
| Ginder Bradley R | $244,900 | None Available |
Source: Public Records
Mortgage History
| Date | Status | Borrower | Loan Amount |
|---|---|---|---|
| Open | Ginder Bradley R | $232,655 |
Source: Public Records
Tax History Compared to Growth
Tax History
| Year | Tax Paid | Tax Assessment Tax Assessment Total Assessment is a certain percentage of the fair market value that is determined by local assessors to be the total taxable value of land and additions on the property. | Land | Improvement |
|---|---|---|---|---|
| 2025 | $4,516 | $218,100 | $50,700 | $167,400 |
| 2024 | $4,516 | $218,100 | $50,700 | $167,400 |
| 2023 | $4,221 | $208,200 | $50,700 | $157,500 |
| 2022 | $4,062 | $208,200 | $50,700 | $157,500 |
| 2021 | $3,944 | $208,200 | $50,700 | $157,500 |
| 2020 | $3,944 | $208,200 | $50,700 | $157,500 |
| 2019 | $3,875 | $208,200 | $50,700 | $157,500 |
| 2018 | $2,868 | $208,200 | $50,700 | $157,500 |
| 2017 | $3,886 | $167,100 | $33,500 | $133,600 |
| 2016 | $3,886 | $167,100 | $33,500 | $133,600 |
| 2015 | $917 | $167,100 | $33,500 | $133,600 |
| 2014 | -- | $167,100 | $33,500 | $133,600 |
Source: Public Records
Map
Nearby Homes
- 162 N Charlotte St
- 51 S Snyder St
- 188 N Main St
- 28 N Grant St
- 32 S Fulton St
- 1443 Shumaker Rd
- 2 S Charlotte St
- 55 S Grant St
- 218 W Ferdinand St
- 18 Crystal Dr
- 113 S Grant St
- 142 N Colebrook Rd
- 43 W Ferdinand St
- 37 W Ferdinand St
- 33 W Ferdinand St
- 27 W Ferdinand St
- 140 S Charlotte St
- 108 110 S Main St
- 123 S Main St
- 125 S Main St