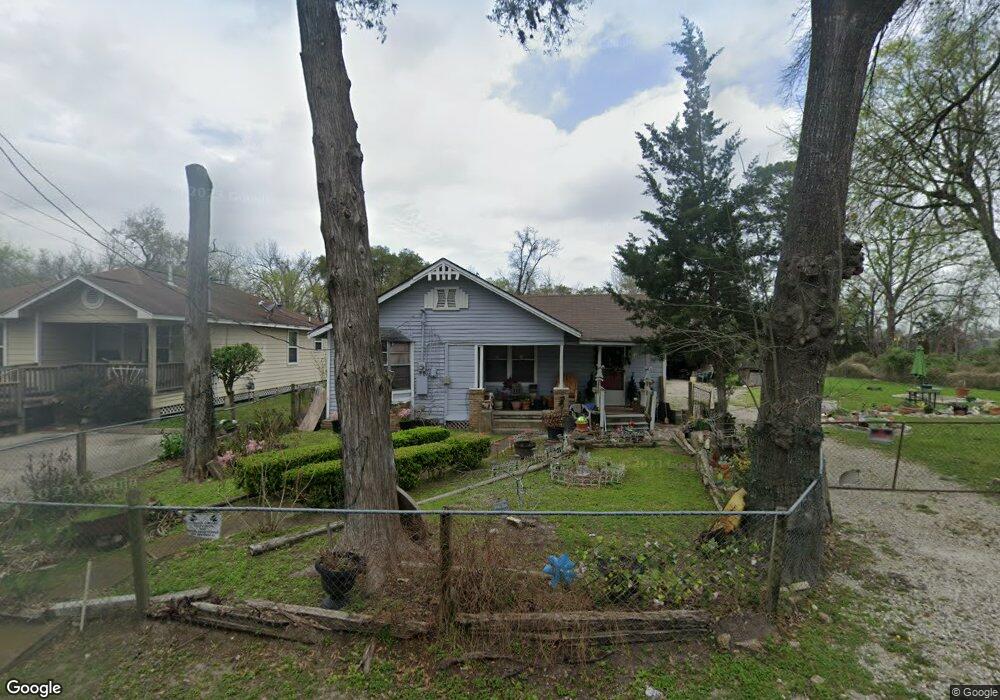
730 Rachel St Houston, TX 77091
Acres Homes NeighborhoodEstimated Value: $228,414 - $294,000
3
Beds
2
Baths
1,404
Sq Ft
$181/Sq Ft
Est. Value
About This Home
This home is located at 730 Rachel St, Houston, TX 77091 and is currently estimated at $254,104, approximately $180 per square foot. 730 Rachel St is a home located in Harris County with nearby schools including Wesley Elementary School, Williams Middle, and Booker T Washington Sr High.
Ownership History
Date
Name
Owned For
Owner Type
Purchase Details
Closed on
Feb 24, 2009
Sold by
Jackson Bettie J
Bought by
Edmond Clara M
Current Estimated Value
Home Financials for this Owner
Home Financials are based on the most recent Mortgage that was taken out on this home.
Original Mortgage
$15,000
Interest Rate
4.92%
Mortgage Type
Seller Take Back
Purchase Details
Closed on
Feb 8, 2008
Sold by
Jackson Bettie J
Bought by
Jackson Bettie J
Create a Home Valuation Report for This Property
The Home Valuation Report is an in-depth analysis detailing your home's value as well as a comparison with similar homes in the area
Home Values in the Area
Average Home Value in this Area
Purchase History
| Date | Buyer | Sale Price | Title Company |
|---|---|---|---|
| Edmond Clara M | -- | None Available | |
| Jackson Bettie J | -- | None Available |
Source: Public Records
Mortgage History
| Date | Status | Borrower | Loan Amount |
|---|---|---|---|
| Closed | Edmond Clara M | $15,000 |
Source: Public Records
Tax History Compared to Growth
Tax History
| Year | Tax Paid | Tax Assessment Tax Assessment Total Assessment is a certain percentage of the fair market value that is determined by local assessors to be the total taxable value of land and additions on the property. | Land | Improvement |
|---|---|---|---|---|
| 2025 | $1,594 | $269,510 | $233,697 | $35,813 |
| 2024 | $1,594 | $214,815 | $179,002 | $35,813 |
| 2023 | $1,594 | $227,200 | $179,002 | $48,198 |
| 2022 | $1,583 | $181,639 | $159,113 | $22,526 |
| 2021 | $1,524 | $125,675 | $104,418 | $21,257 |
| 2020 | $1,439 | $99,543 | $79,556 | $19,987 |
| 2019 | $1,367 | $61,610 | $43,089 | $18,521 |
| 2018 | $0 | $57,696 | $43,089 | $14,607 |
| 2017 | $1,129 | $44,655 | $30,778 | $13,877 |
| 2016 | $1,129 | $44,655 | $30,778 | $13,877 |
| 2015 | $743 | $44,655 | $30,778 | $13,877 |
| 2014 | $743 | $44,655 | $30,778 | $13,877 |
Source: Public Records
Map
Nearby Homes
- 6105 Morrow St
- 0 Brinkman Unit 54849680
- 6032 Beall St
- 6610 Morrow St
- 778 Pickering St
- 5503 Beall St Unit A
- 6204 Maybell St
- 6341 W Montgomery Rd
- 6343 W Montgomery Rd
- 6026 Maybell St
- 6023 Maybell St
- 6021 Maybell St
- 0 Mansfield St St Unit 43691321
- 6502 W Montgomery Rd
- 853 Rachel St
- 810 Elkhart St Unit B
- 810 Elkhart St Unit A
- 5931 Beall St Unit A-D
- 5931 Beall St Unit D
- 5931 Beall St Unit A-B