Estimated Value: $239,000 - $307,000
3
Beds
2
Baths
1,530
Sq Ft
$173/Sq Ft
Est. Value
About This Home
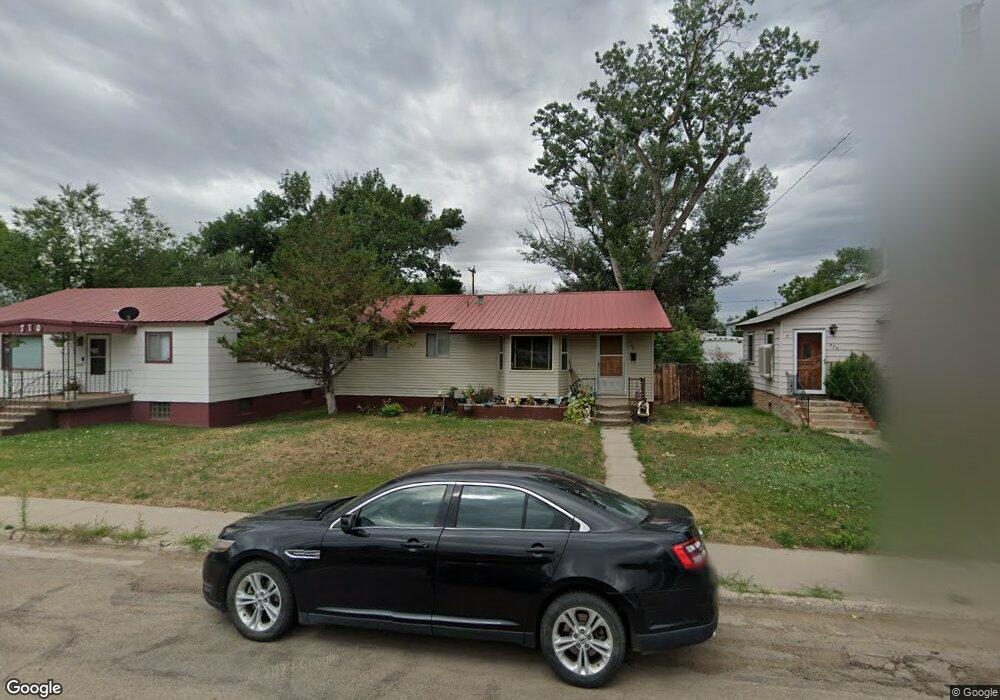
This home is located at 730 Russell St, Craig, CO 81625 and is currently estimated at $264,614, approximately $172 per square foot. 730 Russell St is a home located in Moffat County with nearby schools including Sandrock Elementary School, Moffat County High School, and Calvary Baptist School.
Ownership History
Date
Name
Owned For
Owner Type
Purchase Details
Closed on
Nov 8, 2011
Sold by
Prudential Relocation Inc
Bought by
Crain Matthew G and Crain Jennafer L
Current Estimated Value
Home Financials for this Owner
Home Financials are based on the most recent Mortgage that was taken out on this home.
Original Mortgage
$107,211
Outstanding Balance
$72,576
Interest Rate
3.87%
Mortgage Type
FHA
Estimated Equity
$192,038
Purchase Details
Closed on
Aug 15, 2011
Sold by
Casterson Jeremy and Casterson Emma
Bought by
Prudential Relocation Inc
Create a Home Valuation Report for This Property
The Home Valuation Report is an in-depth analysis detailing your home's value as well as a comparison with similar homes in the area
Home Values in the Area
Average Home Value in this Area
Purchase History
| Date | Buyer | Sale Price | Title Company |
|---|---|---|---|
| Crain Matthew G | $110,000 | None Available | |
| Prudential Relocation Inc | $141,000 | None Available |
Source: Public Records
Mortgage History
| Date | Status | Borrower | Loan Amount |
|---|---|---|---|
| Open | Crain Matthew G | $107,211 |
Source: Public Records
Tax History Compared to Growth
Tax History
| Year | Tax Paid | Tax Assessment Tax Assessment Total Assessment is a certain percentage of the fair market value that is determined by local assessors to be the total taxable value of land and additions on the property. | Land | Improvement |
|---|---|---|---|---|
| 2024 | $778 | $8,970 | $0 | $0 |
| 2023 | $778 | $8,970 | $850 | $8,120 |
| 2022 | $793 | $9,410 | $1,240 | $8,170 |
| 2021 | $801 | $9,670 | $1,270 | $8,400 |
| 2020 | $718 | $8,780 | $1,270 | $7,510 |
| 2019 | $711 | $8,780 | $1,270 | $7,510 |
| 2018 | $607 | $7,460 | $1,280 | $6,180 |
| 2017 | $626 | $7,460 | $1,280 | $6,180 |
| 2016 | $683 | $8,420 | $1,420 | $7,000 |
| 2015 | $716 | $8,420 | $1,420 | $7,000 |
| 2013 | $716 | $8,700 | $1,420 | $7,280 |
Source: Public Records
Map
Nearby Homes