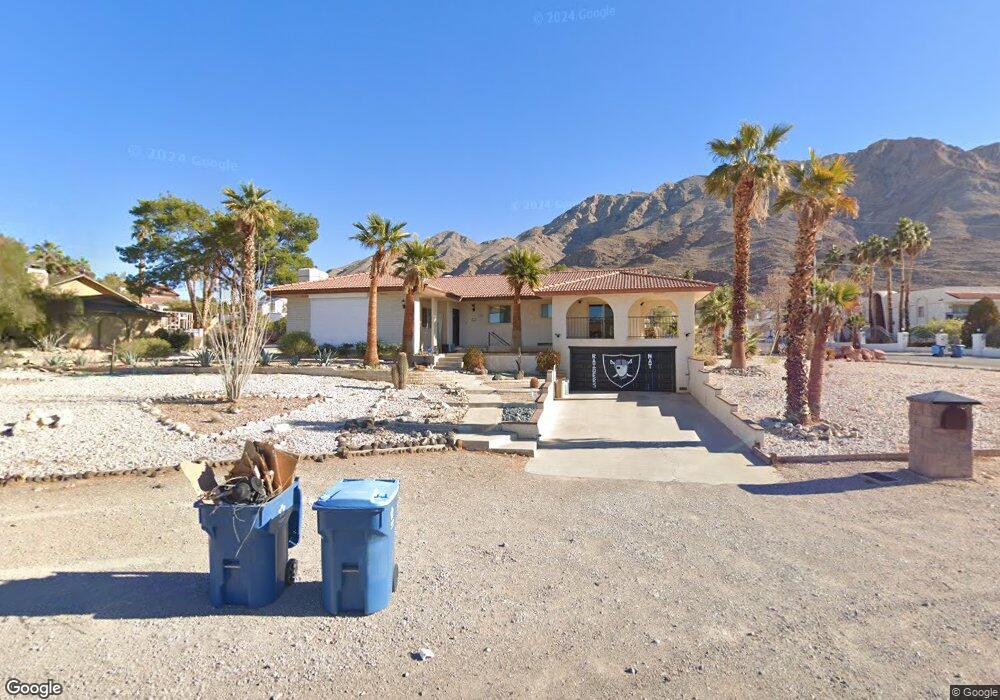
730 Sari Dr Las Vegas, NV 89110
Estimated Value: $517,000 - $572,000
3
Beds
2
Baths
2,042
Sq Ft
$263/Sq Ft
Est. Value
About This Home
This home is located at 730 Sari Dr, Las Vegas, NV 89110 and is currently estimated at $537,244, approximately $263 per square foot. 730 Sari Dr is a home located in Clark County with nearby schools including Mervin Iverson Elementary School, Kathleen & Tim Harney Middle School, and Las Vegas High School.
Ownership History
Date
Name
Owned For
Owner Type
Purchase Details
Closed on
Nov 27, 2021
Sold by
Valles Ortiz Vianeth Viviana
Bought by
Romero Adolfo Liedras
Current Estimated Value
Home Financials for this Owner
Home Financials are based on the most recent Mortgage that was taken out on this home.
Original Mortgage
$336,000
Outstanding Balance
$318,930
Interest Rate
3.05%
Mortgage Type
New Conventional
Estimated Equity
$218,314
Purchase Details
Closed on
Nov 17, 2021
Sold by
Doris E Bene Revocable Trust
Bought by
Romero Adolfo Piedras
Home Financials for this Owner
Home Financials are based on the most recent Mortgage that was taken out on this home.
Original Mortgage
$336,000
Outstanding Balance
$318,930
Interest Rate
3.05%
Mortgage Type
New Conventional
Estimated Equity
$218,314
Purchase Details
Closed on
Jan 12, 2000
Sold by
Bene Doris E
Bought by
Bene Doris E and Doris E Bene Revocable Trust
Create a Home Valuation Report for This Property
The Home Valuation Report is an in-depth analysis detailing your home's value as well as a comparison with similar homes in the area
Home Values in the Area
Average Home Value in this Area
Purchase History
| Date | Buyer | Sale Price | Title Company |
|---|---|---|---|
| Romero Adolfo Liedras | -- | Stewart Title | |
| Romero Adolfo Piedras | $420,000 | Stewart Title | |
| Bene Doris E | -- | -- |
Source: Public Records
Mortgage History
| Date | Status | Borrower | Loan Amount |
|---|---|---|---|
| Open | Romero Adolfo Liedras | $336,000 |
Source: Public Records
Tax History Compared to Growth
Tax History
| Year | Tax Paid | Tax Assessment Tax Assessment Total Assessment is a certain percentage of the fair market value that is determined by local assessors to be the total taxable value of land and additions on the property. | Land | Improvement |
|---|---|---|---|---|
| 2025 | $1,795 | $86,447 | $43,750 | $42,697 |
| 2024 | $1,662 | $86,447 | $43,750 | $42,697 |
| 2023 | $1,662 | $91,721 | $49,000 | $42,721 |
| 2022 | $1,539 | $82,472 | $42,000 | $40,472 |
| 2021 | $1,426 | $74,559 | $35,000 | $39,559 |
| 2020 | $1,381 | $75,160 | $35,000 | $40,160 |
| 2019 | $1,341 | $70,236 | $29,750 | $40,486 |
| 2018 | $1,302 | $68,096 | $28,000 | $40,096 |
| 2017 | $2,039 | $69,525 | $28,000 | $41,525 |
| 2016 | $1,234 | $62,131 | $19,250 | $42,881 |
| 2015 | $1,231 | $56,993 | $14,000 | $42,993 |
| 2014 | $1,195 | $44,973 | $12,250 | $32,723 |
Source: Public Records
Map
Nearby Homes
- 738 Rossmore Dr
- 853 Morning Sun Ct
- 706 N Hollywood Blvd
- 650 N Hollywood Blvd
- 485 Sari Dr
- 1086 Eastridge Way
- 956 Sugar Springs Dr
- 807 Sun Shimmer Place
- 6688 Martinsville Place
- 1030 Pearl Peak St
- 437 Rossmore Dr
- 6561 Alma White St
- 440 Probst
- 6538 Astorville Ct
- 1166 Panorama Heights St
- 255 Vista Valley St
- 0 Vista Valley St
- 0 Peaceful St
- 1083 Sterling Peak St
- 0 Linden Ave