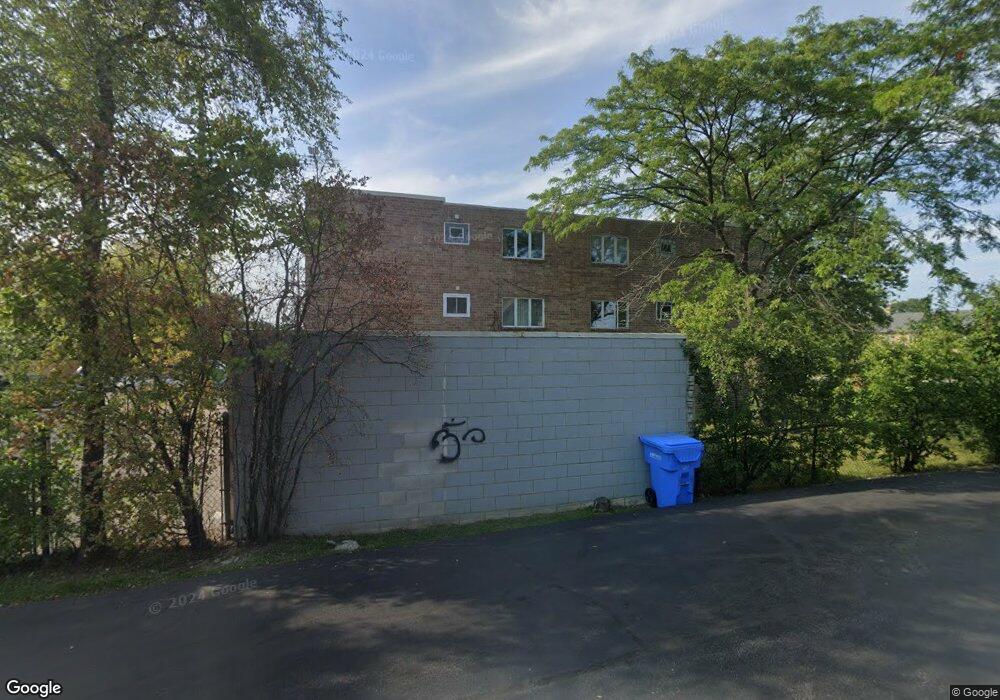
730 Sheridan Rd Unit 1C Highwood, IL 60040
Estimated Value: $187,000 - $468,000
2
Beds
1
Bath
1,123
Sq Ft
$240/Sq Ft
Est. Value
About This Home
This home is located at 730 Sheridan Rd Unit 1C, Highwood, IL 60040 and is currently estimated at $269,731, approximately $240 per square foot. 730 Sheridan Rd Unit 1C is a home located in Lake County with nearby schools including Wayne Thomas Elementary School, Northwood Jr High School, and Highland Park High School.
Ownership History
Date
Name
Owned For
Owner Type
Purchase Details
Closed on
Jan 24, 2025
Sold by
Mancilla Nelson
Bought by
Trust Number 9002347891 and Chicago Title Land Trust
Current Estimated Value
Purchase Details
Closed on
Oct 19, 2004
Sold by
Maday Karla A and Giese Karla A
Bought by
Mancilla Nelson
Home Financials for this Owner
Home Financials are based on the most recent Mortgage that was taken out on this home.
Original Mortgage
$120,000
Interest Rate
5%
Mortgage Type
Purchase Money Mortgage
Purchase Details
Closed on
May 30, 2001
Sold by
Weiss Alfred M and Weiss John
Bought by
Maday Karla A
Home Financials for this Owner
Home Financials are based on the most recent Mortgage that was taken out on this home.
Original Mortgage
$76,000
Interest Rate
6.88%
Create a Home Valuation Report for This Property
The Home Valuation Report is an in-depth analysis detailing your home's value as well as a comparison with similar homes in the area
Home Values in the Area
Average Home Value in this Area
Purchase History
| Date | Buyer | Sale Price | Title Company |
|---|---|---|---|
| Trust Number 9002347891 | -- | Chicago Title | |
| Mancilla Nelson | $150,000 | Ticor | |
| Maday Karla A | $95,000 | Ticor Title Insurance Compan |
Source: Public Records
Mortgage History
| Date | Status | Borrower | Loan Amount |
|---|---|---|---|
| Previous Owner | Mancilla Nelson | $120,000 | |
| Previous Owner | Maday Karla A | $76,000 | |
| Closed | Maday Karla A | $9,500 | |
| Closed | Mancilla Nelson | $15,000 |
Source: Public Records
Tax History Compared to Growth
Tax History
| Year | Tax Paid | Tax Assessment Tax Assessment Total Assessment is a certain percentage of the fair market value that is determined by local assessors to be the total taxable value of land and additions on the property. | Land | Improvement |
|---|---|---|---|---|
| 2024 | $3,024 | $48,510 | $4,032 | $44,478 |
| 2023 | $3,006 | $43,726 | $3,634 | $40,092 |
| 2022 | $3,006 | $40,554 | $3,992 | $36,562 |
| 2021 | $2,768 | $39,202 | $3,859 | $35,343 |
| 2020 | $2,703 | $39,202 | $3,859 | $35,343 |
| 2019 | $2,627 | $39,019 | $3,841 | $35,178 |
| 2018 | $2,490 | $38,734 | $3,883 | $34,851 |
| 2017 | $2,459 | $38,511 | $3,861 | $34,650 |
| 2016 | $2,344 | $40,437 | $3,676 | $36,761 |
| 2015 | $2,542 | $37,570 | $3,415 | $34,155 |
| 2014 | $2,386 | $35,736 | $3,458 | $32,278 |
| 2012 | $2,345 | $35,944 | $3,478 | $32,466 |
Source: Public Records
Map
Nearby Homes
- 512 Hill St
- 738 Lyster Rd Unit 1
- 3287 Western Ave
- 3260 Western Ave
- 3373 Brook Rd
- 535 Lockard Ln
- 525 Lockard Ln
- 221 Burchell Ave
- 3504 Dato Ave
- 228 Llewellyn Ave
- 0 Patten Rd
- 3760 Gilgare Ln
- 34 Logan Loop Unit 242
- 912 Morningside Dr
- 417 Temple Ave
- 927 Half Day Rd
- 736 Morningside Dr
- 701 Morningside Dr
- 2524 Augusta Way
- 1 Burtis Ave
- 730 Sheridan Rd Unit 3B
- 730 Sheridan Rd Unit 2A
- 730 Sheridan Rd Unit 3D
- 730 Sheridan Rd Unit 3C
- 730 Sheridan Rd Unit 3B
- 730 Sheridan Rd Unit 3A
- 730 Sheridan Rd Unit 2D
- 730 Sheridan Rd Unit 2C
- 730 Sheridan Rd Unit 2B
- 730 Sheridan Rd Unit 2A
- 730 Sheridan Rd Unit 1D
- 730 Sheridan Rd Unit 1B
- 730 Sheridan Rd Unit 1A
- 510 Hill St
- 742 Sheridan Rd Unit 1
- 742 Sheridan Rd Unit 4
- 60 Westover Rd
- 64 Westover Rd
- 66 Westover Rd
- 820 Green Bay Rd