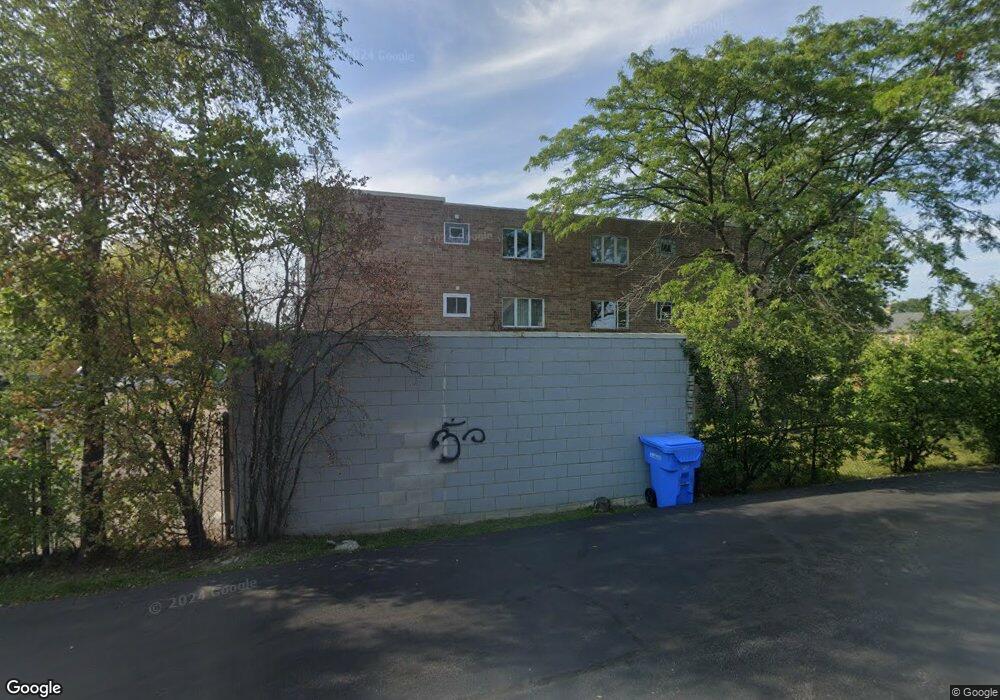
730 Sheridan Rd Unit 2A Highwood, IL 60040
Highwood NeighborhoodEstimated Value: $201,387 - $490,000
2
Beds
1
Bath
1,123
Sq Ft
$252/Sq Ft
Est. Value
About This Home
This home is located at 730 Sheridan Rd Unit 2A, Highwood, IL 60040 and is currently estimated at $283,347, approximately $252 per square foot. 730 Sheridan Rd Unit 2A is a home located in Lake County with nearby schools including Wayne Thomas Elementary School, Northwood Jr High School, and Highland Park High School.
Ownership History
Date
Name
Owned For
Owner Type
Purchase Details
Closed on
Aug 23, 2002
Sold by
Roberts Clifford E
Bought by
Zepeda Emelia
Current Estimated Value
Home Financials for this Owner
Home Financials are based on the most recent Mortgage that was taken out on this home.
Original Mortgage
$120,000
Interest Rate
6.34%
Purchase Details
Closed on
Nov 19, 1999
Sold by
Vandeur Christian
Bought by
Roberts Clifford Earl
Purchase Details
Closed on
Sep 15, 1997
Sold by
Cruz Leticia and Tenorio Ascencion
Bought by
Roberts Clifford E
Home Financials for this Owner
Home Financials are based on the most recent Mortgage that was taken out on this home.
Original Mortgage
$66,800
Interest Rate
7.55%
Create a Home Valuation Report for This Property
The Home Valuation Report is an in-depth analysis detailing your home's value as well as a comparison with similar homes in the area
Home Values in the Area
Average Home Value in this Area
Purchase History
| Date | Buyer | Sale Price | Title Company |
|---|---|---|---|
| Zepeda Emelia | $140,000 | -- | |
| Roberts Clifford Earl | $10,000 | -- | |
| Roberts Clifford E | $55,666 | Imperial Land Title Inc |
Source: Public Records
Mortgage History
| Date | Status | Borrower | Loan Amount |
|---|---|---|---|
| Previous Owner | Zepeda Emelia | $120,000 | |
| Previous Owner | Roberts Clifford E | $30,000 | |
| Previous Owner | Roberts Clifford E | $66,800 |
Source: Public Records
Tax History Compared to Growth
Tax History
| Year | Tax Paid | Tax Assessment Tax Assessment Total Assessment is a certain percentage of the fair market value that is determined by local assessors to be the total taxable value of land and additions on the property. | Land | Improvement |
|---|---|---|---|---|
| 2024 | $3,007 | $48,292 | $4,032 | $44,260 |
| 2023 | $2,573 | $43,529 | $3,634 | $39,895 |
| 2022 | $2,573 | $35,577 | $3,992 | $31,585 |
| 2021 | $2,367 | $34,391 | $3,859 | $30,532 |
| 2020 | $2,312 | $34,391 | $3,859 | $30,532 |
| 2019 | $2,247 | $34,230 | $3,841 | $30,389 |
| 2018 | $2,490 | $38,734 | $3,883 | $34,851 |
| 2017 | $2,459 | $38,511 | $3,861 | $34,650 |
| 2016 | $2,344 | $40,437 | $3,676 | $36,761 |
| 2015 | $2,542 | $37,570 | $3,415 | $34,155 |
| 2014 | $2,386 | $35,736 | $3,458 | $32,278 |
| 2012 | $2,345 | $35,944 | $3,478 | $32,466 |
Source: Public Records
Map
Nearby Homes
- 818 Green Bay Rd
- 514 Hill St
- 762 Deroo Loop Unit 5
- 738 Lyster Rd Unit 1
- 535 Lockard Ln
- 525 Lockard Ln
- 540 Green Bay Rd
- 538 Green Bay Rd
- 522 N Central Ave
- 2936 Warbler Place
- 0 Patten Rd
- 3544 Patten Rd
- 500 Lake View Ave Unit 2A
- 3507 Bradley Ct
- 644 Hyacinth Place
- 602 Old Elm Rd
- 139 Leonard Wood N
- 3760 Gilgare Ln
- 912 Morningside Dr
- 417 Temple Ave
- 730 Sheridan Rd Unit 3B
- 730 Sheridan Rd Unit 3D
- 730 Sheridan Rd Unit 3C
- 730 Sheridan Rd Unit 3B
- 730 Sheridan Rd Unit 3A
- 730 Sheridan Rd Unit 2D
- 730 Sheridan Rd Unit 2C
- 730 Sheridan Rd Unit 2B
- 730 Sheridan Rd Unit 2A
- 730 Sheridan Rd Unit 1D
- 730 Sheridan Rd Unit 1C
- 730 Sheridan Rd Unit 1B
- 730 Sheridan Rd Unit 1A
- 510 Hill St
- 742 Sheridan Rd Unit 1
- 742 Sheridan Rd Unit 4
- 60 Westover Rd
- 64 Westover Rd
- 66 Westover Rd
- 820 Green Bay Rd