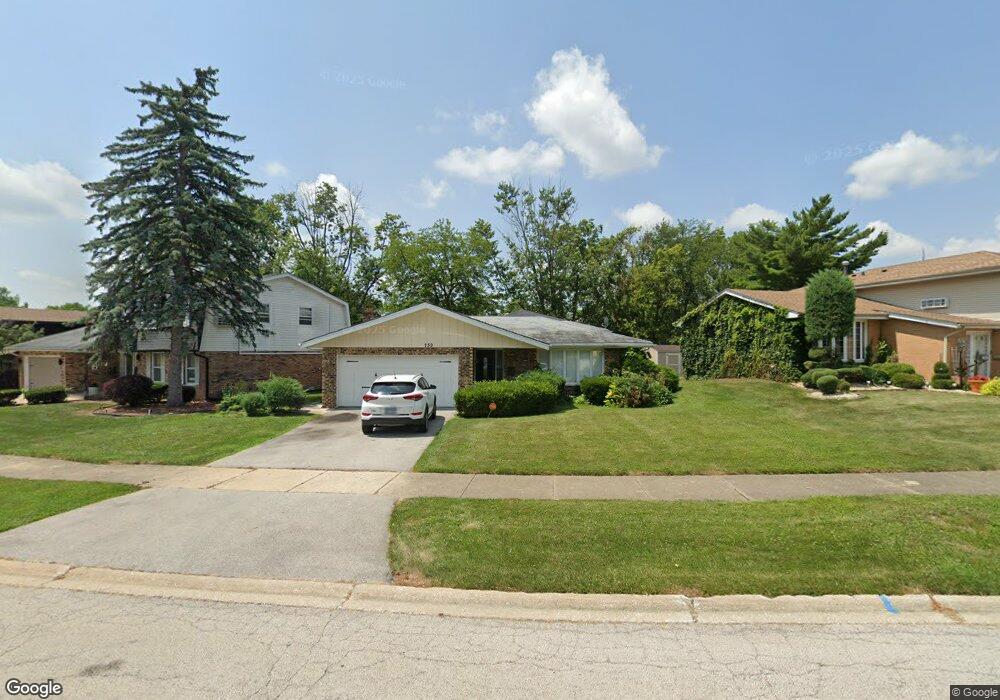
730 Violet Ln Matteson, IL 60443
Old Matteson NeighborhoodEstimated Value: $290,000 - $335,000
3
Beds
3
Baths
2,348
Sq Ft
$136/Sq Ft
Est. Value
About This Home
This home is located at 730 Violet Ln, Matteson, IL 60443 and is currently estimated at $319,230, approximately $135 per square foot. 730 Violet Ln is a home located in Cook County with nearby schools including Illinois School, Arcadia Elementary School, and Indiana Elementary School.
Ownership History
Date
Name
Owned For
Owner Type
Purchase Details
Closed on
Jun 30, 2017
Sold by
257 Investments Inc
Bought by
Archer Brian
Current Estimated Value
Home Financials for this Owner
Home Financials are based on the most recent Mortgage that was taken out on this home.
Original Mortgage
$174,775
Outstanding Balance
$149,970
Interest Rate
5.5%
Mortgage Type
FHA
Estimated Equity
$169,260
Purchase Details
Closed on
Dec 10, 2015
Sold by
Rodgers Roy and Rodgers Iris I
Bought by
257 Investments Inc
Purchase Details
Closed on
Oct 18, 2000
Sold by
Rodgers Roy
Bought by
Rodgers Iris I
Purchase Details
Closed on
May 26, 1994
Sold by
Cisneros Henry G
Bought by
Rodgers Roy and Rodgers Iris I
Home Financials for this Owner
Home Financials are based on the most recent Mortgage that was taken out on this home.
Original Mortgage
$113,804
Interest Rate
8.58%
Mortgage Type
FHA
Create a Home Valuation Report for This Property
The Home Valuation Report is an in-depth analysis detailing your home's value as well as a comparison with similar homes in the area
Home Values in the Area
Average Home Value in this Area
Purchase History
| Date | Buyer | Sale Price | Title Company |
|---|---|---|---|
| Archer Brian | $178,000 | Fidelity National Title Comp | |
| 257 Investments Inc | $55,000 | Attorney | |
| Rodgers Iris I | -- | -- | |
| Rodgers Roy | -- | -- |
Source: Public Records
Mortgage History
| Date | Status | Borrower | Loan Amount |
|---|---|---|---|
| Open | Archer Brian | $174,775 | |
| Previous Owner | Rodgers Roy | $113,804 |
Source: Public Records
Tax History
| Year | Tax Paid | Tax Assessment Tax Assessment Total Assessment is a certain percentage of the fair market value that is determined by local assessors to be the total taxable value of land and additions on the property. | Land | Improvement |
|---|---|---|---|---|
| 2025 | $10,202 | $26,300 | $3,022 | $23,278 |
| 2024 | $10,202 | $26,300 | $3,022 | $23,278 |
| 2023 | $6,104 | $28,000 | $3,022 | $24,978 |
| 2022 | $6,104 | $14,674 | $2,645 | $12,029 |
| 2021 | $6,237 | $14,672 | $2,644 | $12,028 |
| 2020 | $7,473 | $14,672 | $2,644 | $12,028 |
| 2019 | $9,204 | $17,783 | $2,455 | $15,328 |
| 2018 | $9,202 | $17,783 | $2,455 | $15,328 |
| 2017 | $7,158 | $17,783 | $2,455 | $15,328 |
| 2016 | $6,663 | $16,048 | $2,266 | $13,782 |
| 2015 | $6,544 | $16,048 | $2,266 | $13,782 |
| 2014 | $6,365 | $16,048 | $2,266 | $13,782 |
| 2013 | $6,537 | $17,775 | $2,266 | $15,509 |
Source: Public Records
Map
Nearby Homes
- 831 Violet Ln
- 4110 Applewood Ln
- 4242 Pinewood Ln
- 888 Woodstock Rd
- 20920 Governors Hwy
- 4325 Oakwood Ln
- 739 Kostner Ave
- 30 Strauss Ln
- 722 Kostner Ave
- 4012 204th St
- 20535 Marathon Ct
- 20869 Greenwood Dr
- 21142 Locust St
- 20436 Arcadian Dr
- 20415 Doria Ln
- 21308 Tower Ave
- 3919 214th St
- 4500 203rd St
- 154 Sundance Rd
- 3802 213th Place
- 4025 Violet Ln
- 736 Violet Ln
- 4031 Violet Ln
- 742 Violet Ln
- 741 Carnation Ln
- 739 Carnation Ln
- 4037 Violet Ln
- 746 Violet Ln
- 731 Violet Ln
- 725 Violet Ln
- 735 Violet Ln
- 745 Carnation Ln
- 739 Violet Ln Unit 2
- 4041 Violet Ln
- 737 Carnation Ln
- 800 Violet Ln
- 745 Violet Ln
- 719 Violet Ln
- 4026 Violet Ln
- 749 Violet Ln
Your Personal Tour Guide
Ask me questions while you tour the home.