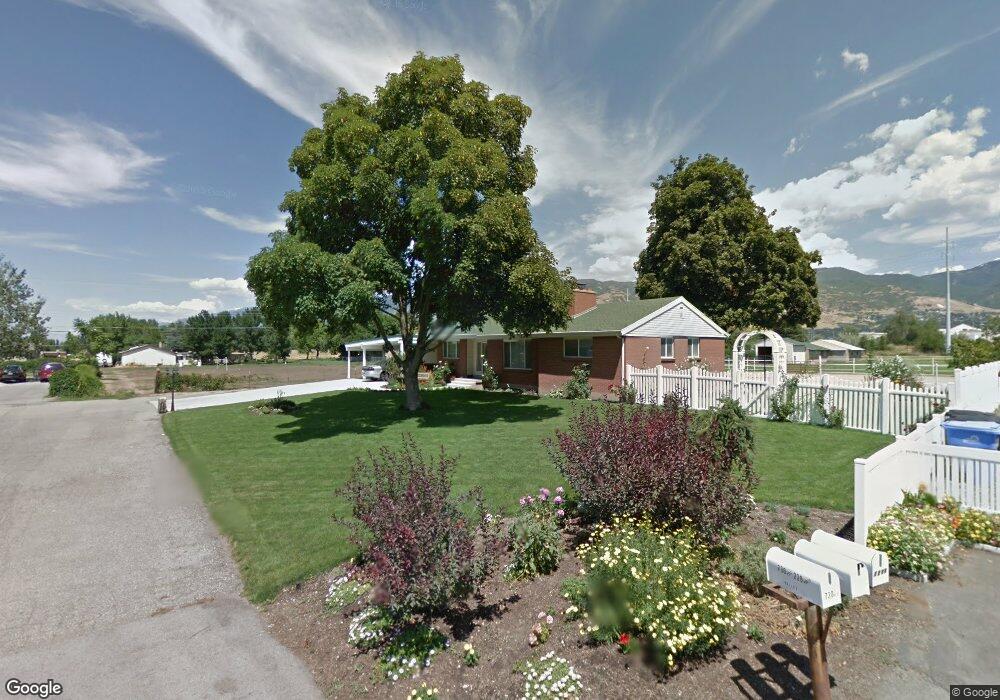
730 W 220 N West Bountiful, UT 84087
Estimated Value: $869,000 - $1,027,000
5
Beds
4
Baths
4,476
Sq Ft
$214/Sq Ft
Est. Value
About This Home
This home is located at 730 W 220 N, West Bountiful, UT 84087 and is currently estimated at $960,021, approximately $214 per square foot. 730 W 220 N is a home located in Davis County with nearby schools including West Bountiful Elementary School, Bountiful Junior High School, and Viewmont High School.
Ownership History
Date
Name
Owned For
Owner Type
Purchase Details
Closed on
Oct 23, 2023
Sold by
Wendel Gregory and Chitds Lenna Christine
Bought by
Wender Gregory and Wendel Lenna Christine
Current Estimated Value
Purchase Details
Closed on
Jun 13, 2017
Sold by
Wendel Gregory
Bought by
Wendel Gregory and Childs Lenna Christine
Purchase Details
Closed on
Jun 16, 2016
Sold by
Reed Susan S Hailes
Bought by
Wendel Gregory
Home Financials for this Owner
Home Financials are based on the most recent Mortgage that was taken out on this home.
Original Mortgage
$388,550
Interest Rate
3.54%
Purchase Details
Closed on
Sep 29, 2009
Sold by
Hailes Irma R
Bought by
Hailes Irma R and Hailes Susan S
Home Financials for this Owner
Home Financials are based on the most recent Mortgage that was taken out on this home.
Original Mortgage
$92,800
Interest Rate
5.08%
Mortgage Type
New Conventional
Create a Home Valuation Report for This Property
The Home Valuation Report is an in-depth analysis detailing your home's value as well as a comparison with similar homes in the area
Home Values in the Area
Average Home Value in this Area
Purchase History
| Date | Buyer | Sale Price | Title Company |
|---|---|---|---|
| Wender Gregory | -- | None Listed On Document | |
| Wendel Gregory | -- | -- | |
| Wendel Gregory | -- | -- | |
| Hailes Irma R | -- | Highland Title Agency Inc |
Source: Public Records
Mortgage History
| Date | Status | Borrower | Loan Amount |
|---|---|---|---|
| Previous Owner | Wendel Gregory | $388,550 | |
| Previous Owner | Wendel Gregory | -- | |
| Previous Owner | Hailes Irma R | $92,800 |
Source: Public Records
Tax History Compared to Growth
Tax History
| Year | Tax Paid | Tax Assessment Tax Assessment Total Assessment is a certain percentage of the fair market value that is determined by local assessors to be the total taxable value of land and additions on the property. | Land | Improvement |
|---|---|---|---|---|
| 2025 | $6,567 | $505,338 | $256,998 | $248,340 |
| 2024 | $6,079 | $488,896 | $231,736 | $257,160 |
| 2023 | $5,780 | $814,000 | $349,807 | $464,193 |
| 2022 | $5,863 | $469,150 | $187,931 | $281,219 |
| 2021 | $5,533 | $679,000 | $290,136 | $388,864 |
| 2020 | $4,749 | $563,000 | $234,374 | $328,626 |
| 2019 | $4,712 | $569,000 | $212,422 | $356,578 |
| 2018 | $4,306 | $512,000 | $185,488 | $326,512 |
| 2016 | $3,558 | $248,278 | $125,984 | $122,294 |
| 2015 | $3,172 | $211,483 | $125,984 | $85,499 |
| 2014 | $2,607 | $179,212 | $125,984 | $53,228 |
| 2013 | -- | $158,944 | $73,035 | $85,909 |
Source: Public Records
Map
Nearby Homes
- 767 W 220 N
- 680 W 500 S Unit 22
- 680 W 500 S Unit 17
- 340 N 500 W Unit 204
- 399 W 400 N Unit 47
- 280 N 1100 W
- 167 S 425 W
- 790 N 500 W
- 314 W Center St Unit D135
- 314 W Center St Unit D159
- 314 W Center St Unit E150
- 155 N Peregrine Ln W
- 75 N Peregrine Ln W Unit 8
- 131 W 25 N Unit 4
- 147 W 25 N Unit 5
- 499 N 200 W Unit 30
- 499 N 200 W Unit 19
- 825 W 1320 N
- 366 W 1000 N
- 553 N 200 W