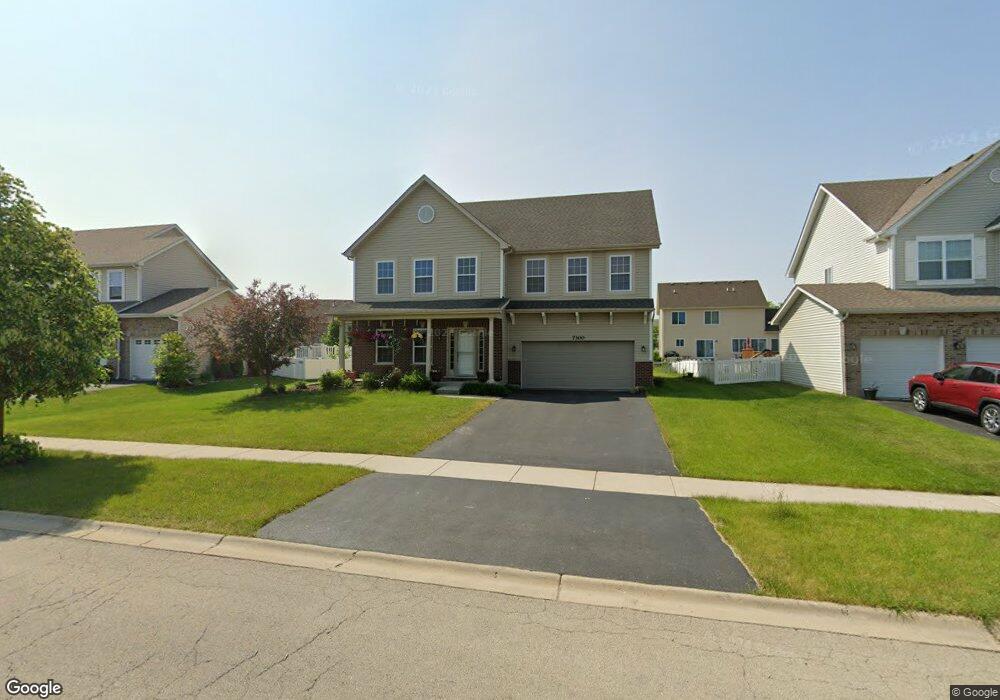
7300 Kempton St Joliet, IL 60431
North Minooka NeighborhoodEstimated Value: $448,000 - $490,000
4
Beds
3
Baths
2,898
Sq Ft
$163/Sq Ft
Est. Value
About This Home
This home is located at 7300 Kempton St, Joliet, IL 60431 and is currently estimated at $471,424, approximately $162 per square foot. 7300 Kempton St is a home with nearby schools including Jones Elementary School, Minooka Junior High School, and Minooka Intermediate School.
Ownership History
Date
Name
Owned For
Owner Type
Purchase Details
Closed on
Feb 28, 2014
Sold by
Stone I Llc
Bought by
Lagadapati Maitreya and Petluru Bhavana
Current Estimated Value
Home Financials for this Owner
Home Financials are based on the most recent Mortgage that was taken out on this home.
Original Mortgage
$273,000
Outstanding Balance
$200,130
Interest Rate
3.5%
Mortgage Type
Adjustable Rate Mortgage/ARM
Estimated Equity
$271,294
Purchase Details
Closed on
Feb 1, 2014
Bought by
Lagadapati Maitreya and Petluru Bhav
Home Financials for this Owner
Home Financials are based on the most recent Mortgage that was taken out on this home.
Original Mortgage
$273,000
Outstanding Balance
$200,130
Interest Rate
3.5%
Mortgage Type
Adjustable Rate Mortgage/ARM
Estimated Equity
$271,294
Purchase Details
Closed on
Jan 29, 2010
Sold by
Guaranty Plus Properties Inc I
Bought by
Stone I Llc
Create a Home Valuation Report for This Property
The Home Valuation Report is an in-depth analysis detailing your home's value as well as a comparison with similar homes in the area
Home Values in the Area
Average Home Value in this Area
Purchase History
| Date | Buyer | Sale Price | Title Company |
|---|---|---|---|
| Lagadapati Maitreya | $86,400 | First American Title | |
| Lagadapati Maitreya | $287,700 | -- | |
| Stone I Llc | $1,350,000 | Chicago Title Insurance Co |
Source: Public Records
Mortgage History
| Date | Status | Borrower | Loan Amount |
|---|---|---|---|
| Open | Lagadapati Maitreya | $273,000 | |
| Closed | Lagadapati Maitreya | -- |
Source: Public Records
Tax History Compared to Growth
Tax History
| Year | Tax Paid | Tax Assessment Tax Assessment Total Assessment is a certain percentage of the fair market value that is determined by local assessors to be the total taxable value of land and additions on the property. | Land | Improvement |
|---|---|---|---|---|
| 2024 | $10,890 | $134,354 | $17,520 | $116,834 |
| 2023 | $8,725 | $120,533 | $14,600 | $105,933 |
| 2022 | $8,725 | $105,171 | $14,042 | $91,129 |
| 2021 | $8,721 | $102,519 | $14,256 | $88,263 |
| 2020 | $8,471 | $98,042 | $14,055 | $83,987 |
| 2019 | $8,634 | $97,912 | $14,342 | $83,570 |
| 2018 | $8,295 | $93,984 | $13,767 | $80,217 |
| 2017 | $8,165 | $88,933 | $13,027 | $75,906 |
| 2016 | $8,150 | $87,835 | $12,866 | $74,969 |
| 2015 | $8,960 | $94,722 | $12,210 | $82,512 |
| 2014 | -- | $73,299 | $10,369 | $62,930 |
| 2013 | -- | $20 | $20 | $0 |
Source: Public Records
Map
Nearby Homes
- 7207 Yorkshire St
- 1503 Kempton St
- 7514 Blueblossom Ln
- 7508 Blueblossom Ln
- 7510 Blueblossom Ln
- 7501 Blueblossom Ln
- 7309 Fordham Ln
- 1306 Bassett Dr
- 7503 Blueblossom Ln
- 1830 Field Ct
- 6916 Astoria Dr
- Siena Plan at Lakewood Prairie - Andare
- Napa Plan at Lakewood Prairie - Andare
- Sonoma Plan at Lakewood Prairie - Andare
- Rutherford Plan at Lakewood Prairie - Andare
- 7509 Prairieside Dr
- Townsend Plan at Lakewood Prairie - Single Family
- Starling Plan at Lakewood Prairie - Single Family
- Siena II Plan at Lakewood Prairie - Single Family
- Wren Plan at Lakewood Prairie - Single Family
- 7302 Kempton St
- 7226 Kempton St
- 1506 Yorkshire Ct
- 1504 Yorkshire Ct
- 7304 Kempton St
- 7224 Kempton St
- 7301 Kempton St
- 7219 Yorkshire St
- 7227 Kempton St
- 1507 Yorkshire Ct
- 7303 Kempton St
- 1502 Yorkshire Ct
- 7306 Kempton St
- 7222 Kempton St
- 7225 Kempton St
- 7305 Kempton St
- 7217 Yorkshire St
- 1508 Seiburg St
- 7223 Kempton St
- 7307 Kempton St