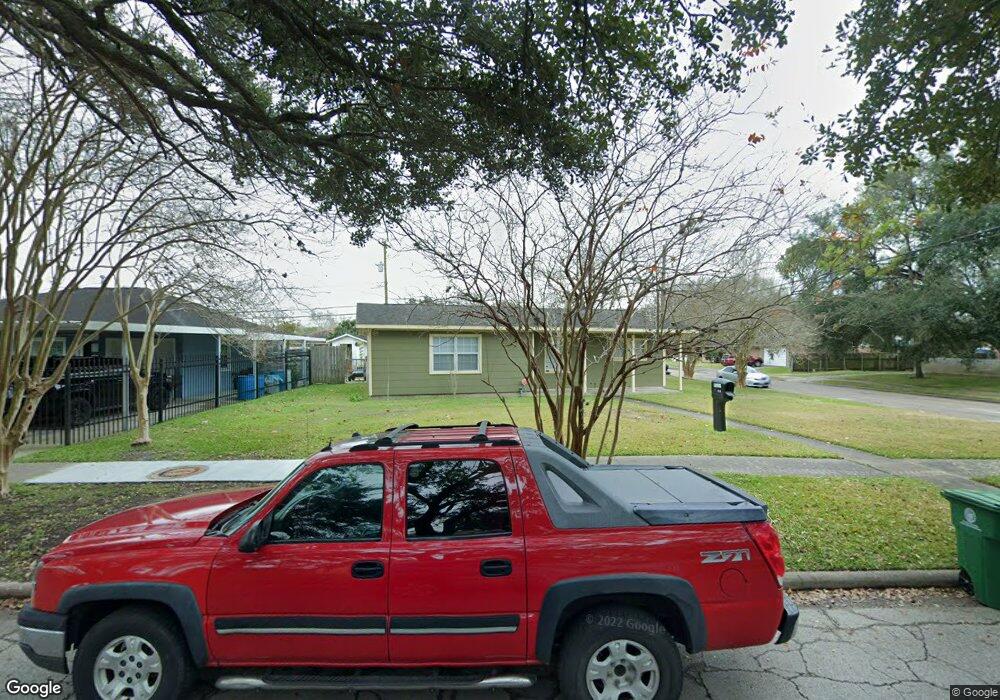
7300 La Paseo St Houston, TX 77087
Golfcrest-Bellfort-Reveille NeighborhoodEstimated Value: $165,439 - $220,000
3
Beds
1
Bath
1,158
Sq Ft
$165/Sq Ft
Est. Value
About This Home
This home is located at 7300 La Paseo St, Houston, TX 77087 and is currently estimated at $191,610, approximately $165 per square foot. 7300 La Paseo St is a home located in Harris County with nearby schools including Cornelius Elementary School, Hartman Middle School, and Ross Shaw Sterling Aviation High School.
Ownership History
Date
Name
Owned For
Owner Type
Purchase Details
Closed on
Feb 18, 2009
Sold by
Hsbc Bank Usa National Association
Bought by
Mendoza Javier
Current Estimated Value
Purchase Details
Closed on
Jul 7, 2008
Sold by
Mortgage Electronic Registration Systems
Bought by
Hsbc Bank Usa Na and Ace 2005-He4
Purchase Details
Closed on
Jul 1, 2008
Sold by
Portilla Ignacio
Bought by
Mortgage Electronic Registration Systems
Purchase Details
Closed on
Apr 25, 2005
Sold by
Perez Maria De Lourdes and Perez Jose Asuncion
Bought by
Portilla Ignacio
Home Financials for this Owner
Home Financials are based on the most recent Mortgage that was taken out on this home.
Original Mortgage
$71,600
Interest Rate
7.95%
Mortgage Type
Fannie Mae Freddie Mac
Purchase Details
Closed on
Mar 31, 2000
Sold by
Valle Rafaela M and Valle Isaac
Bought by
Perez Jose Asuncion and Perez Maria Delourdes
Create a Home Valuation Report for This Property
The Home Valuation Report is an in-depth analysis detailing your home's value as well as a comparison with similar homes in the area
Home Values in the Area
Average Home Value in this Area
Purchase History
| Date | Buyer | Sale Price | Title Company |
|---|---|---|---|
| Mendoza Javier | -- | Lsi Title Agency | |
| Hsbc Bank Usa Na | -- | None Available | |
| Mortgage Electronic Registration Systems | $51,000 | None Available | |
| Portilla Ignacio | -- | First American Title | |
| Perez Jose Asuncion | -- | -- |
Source: Public Records
Mortgage History
| Date | Status | Borrower | Loan Amount |
|---|---|---|---|
| Previous Owner | Portilla Ignacio | $71,600 | |
| Closed | Portilla Ignacio | $17,900 |
Source: Public Records
Tax History Compared to Growth
Tax History
| Year | Tax Paid | Tax Assessment Tax Assessment Total Assessment is a certain percentage of the fair market value that is determined by local assessors to be the total taxable value of land and additions on the property. | Land | Improvement |
|---|---|---|---|---|
| 2025 | $2,912 | $148,297 | $52,486 | $95,811 |
| 2024 | $2,912 | $139,193 | $52,486 | $86,707 |
| 2023 | $2,912 | $155,154 | $52,486 | $102,668 |
| 2022 | $3,209 | $136,432 | $52,486 | $83,946 |
| 2021 | $2,303 | $98,822 | $20,620 | $78,202 |
| 2020 | $2,128 | $82,745 | $20,620 | $62,125 |
| 2019 | $1,993 | $74,339 | $20,620 | $53,719 |
| 2018 | $1,751 | $69,187 | $20,620 | $48,567 |
| 2017 | $1,853 | $69,187 | $20,620 | $48,567 |
| 2016 | $1,853 | $69,187 | $20,620 | $48,567 |
| 2015 | $1,738 | $67,609 | $20,620 | $46,989 |
| 2014 | $1,738 | $67,609 | $20,620 | $46,989 |
Source: Public Records
Map
Nearby Homes
- 6023 Winterhaven Dr
- 6046 Harbrook Dr
- 7309 Moline St
- 7337 Moline St
- 6102 Harbrook Dr
- 7355 Bellfort St
- 6826 Kingsway Dr
- 7819 Leonora St
- 7837 Leonora St
- 3731 Reveille St
- 6751 Richwood Rd
- 7908 Grove Ridge Dr
- 7393 Fairway Dr Unit B
- 7954 Grove Ridge Dr
- 7735 Oak Vista St
- 7936 Grove Ridge Dr
- 7734 El Rancho St
- 7507 Greenstone St
- 3408 Chaffin St
- 7543 Greenstone St
- 7302 La Paseo St
- 7231 Kingsway Dr
- 7304 La Paseo St
- 7222 La Paseo St
- 7235 Kingsway Dr
- 7301 La Paseo St
- 7223 Kingsway Dr
- 7306 La Paseo St
- 7239 Kingsway Dr
- 7220 La Paseo St
- 7305 La Paseo St
- 7221 La Paseo St
- 7219 Kingsway Dr
- 7309 La Paseo St
- 7308 La Paseo St
- 7308 La Paseo St Unit B
- 7218 La Paseo St
- 5909 Lancaster St
- 6003 Lancaster St
- 7215 Kingsway Dr