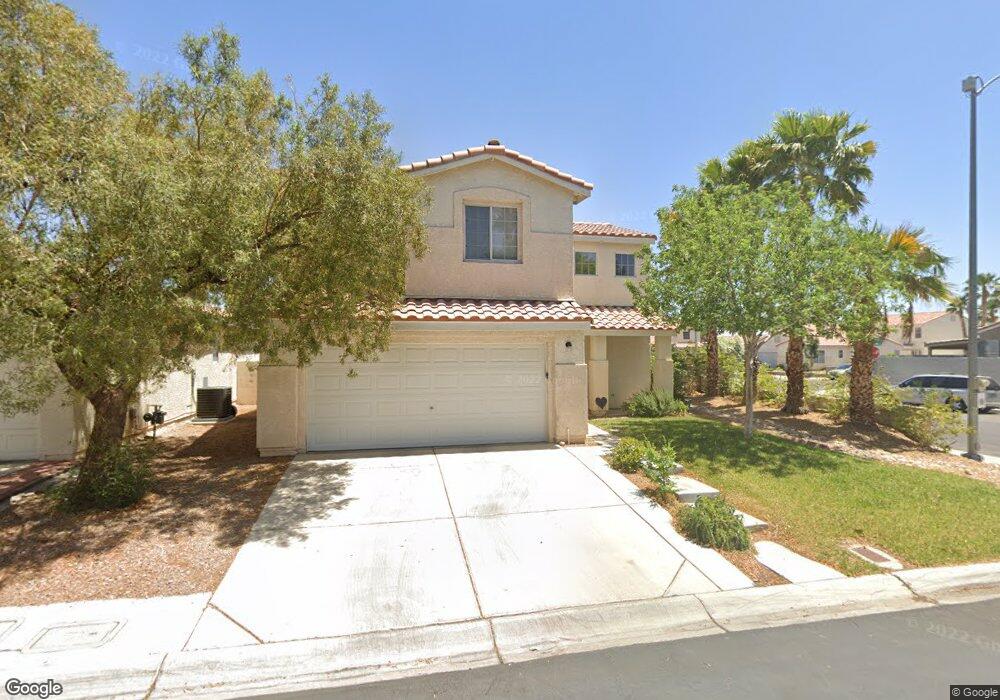
7300 Lost Shadow Ct Las Vegas, NV 89131
Elkhorn Ranch NeighborhoodEstimated Value: $372,509 - $393,000
About This Home
Please note, our homes are available on a first-come, first-serve basis and are not reserved until the lease is signed by all applicants and security deposits are collected.
This home features Progress Smart Home - Progress Residential's smart home app, which allows you to control the home securely from any of your devices. Learn more at
Want to tour on your own? Click the “Self Tour” button on this home’s listing or call to register for a self-guided showing at a time that works best for you.
This quaint 1,343 square foot home has 3 bedrooms 2.5 bathrooms. Property features include: a big kitchen with nice cabinets, plenty of counter space and double sinks, roomy bedrooms, lovely living room, and spacious bathrooms with a lovely master. Gorgeous yard is lush with nicely maintained lawn. Homes this well maintained and move in ready lease quickly. Schedule your tour and submit your application today.
Ownership History
Purchase Details
Purchase Details
Purchase Details
Purchase Details
Home Financials for this Owner
Home Financials are based on the most recent Mortgage that was taken out on this home.Home Values in the Area
Average Home Value in this Area
Purchase History
| Date | Buyer | Sale Price | Title Company |
|---|---|---|---|
| Progress Residential Owner 10 Llc | -- | Os National Llc | |
| Progress Residential Equity Owner 9 Llc | -- | Os National Llc | |
| Progress Res Intermediate Sfr Holdings L | -- | Os National Llc | |
| Progress Residential Equity Owner 10 Llc | -- | Os National Llc | |
| Freo Nevada Llc | $115,100 | Accommodation | |
| Dacaret Hernan E | $139,000 | Old Republic Title Company |
Mortgage History
| Date | Status | Borrower | Loan Amount |
|---|---|---|---|
| Previous Owner | Dacaret Hernan E | $137,063 | |
| Closed | Dacaret Hernan E | $6,950 |
Property History
| Date | Event | Price | List to Sale | Price per Sq Ft |
|---|---|---|---|---|
| 07/08/2025 07/08/25 | Off Market | $1,895 | -- | -- |
| 07/04/2025 07/04/25 | Price Changed | $1,895 | -1.0% | $1 / Sq Ft |
| 07/01/2025 07/01/25 | Price Changed | $1,915 | -0.8% | $1 / Sq Ft |
| 06/30/2025 06/30/25 | Price Changed | $1,930 | +0.3% | $1 / Sq Ft |
| 06/28/2025 06/28/25 | Price Changed | $1,925 | -1.0% | $1 / Sq Ft |
| 06/27/2025 06/27/25 | Price Changed | $1,945 | -1.5% | $1 / Sq Ft |
| 06/24/2025 06/24/25 | Price Changed | $1,975 | -2.7% | $1 / Sq Ft |
| 06/23/2025 06/23/25 | Price Changed | $2,030 | +0.2% | $2 / Sq Ft |
| 06/22/2025 06/22/25 | Price Changed | $2,025 | +0.2% | $2 / Sq Ft |
| 06/20/2025 06/20/25 | Price Changed | $2,020 | -1.7% | $2 / Sq Ft |
| 06/19/2025 06/19/25 | Price Changed | $2,055 | +0.2% | $2 / Sq Ft |
| 06/18/2025 06/18/25 | Price Changed | $2,050 | +0.2% | $2 / Sq Ft |
| 06/17/2025 06/17/25 | Price Changed | $2,045 | -2.4% | $2 / Sq Ft |
| 06/16/2025 06/16/25 | Price Changed | $2,095 | +0.5% | $2 / Sq Ft |
| 06/12/2025 06/12/25 | Price Changed | $2,085 | +0.5% | $2 / Sq Ft |
| 06/08/2025 06/08/25 | Price Changed | $2,075 | +2.0% | $2 / Sq Ft |
| 06/03/2025 06/03/25 | Price Changed | $2,035 | -1.7% | $2 / Sq Ft |
| 06/01/2025 06/01/25 | Price Changed | $2,070 | +1.5% | $2 / Sq Ft |
| 05/27/2025 05/27/25 | Price Changed | $2,040 | -1.9% | $2 / Sq Ft |
| 05/27/2025 05/27/25 | Price Changed | $2,080 | -1.7% | $2 / Sq Ft |
| 05/13/2025 05/13/25 | Price Changed | $2,115 | -23.6% | $2 / Sq Ft |
| 05/13/2025 05/13/25 | For Rent | $2,770 | -- | -- |
Tax History Compared to Growth
Tax History
| Year | Tax Paid | Tax Assessment Tax Assessment Total Assessment is a certain percentage of the fair market value that is determined by local assessors to be the total taxable value of land and additions on the property. | Land | Improvement |
|---|---|---|---|---|
| 2025 | $1,584 | $76,440 | $28,700 | $47,740 |
| 2024 | $1,467 | $76,440 | $28,700 | $47,740 |
| 2023 | $1,467 | $75,417 | $30,100 | $45,317 |
| 2022 | $1,359 | $64,516 | $23,100 | $41,416 |
| 2021 | $1,259 | $60,459 | $21,000 | $39,459 |
| 2020 | $1,166 | $60,215 | $21,000 | $39,215 |
| 2019 | $1,092 | $56,529 | $17,850 | $38,679 |
| 2018 | $1,042 | $50,366 | $13,300 | $37,066 |
| 2017 | $1,632 | $49,769 | $12,250 | $37,519 |
| 2016 | $977 | $46,826 | $9,100 | $37,726 |
| 2015 | $974 | $36,800 | $7,000 | $29,800 |
| 2014 | $1,581 | $28,182 | $7,000 | $21,182 |
Map
- 7320 Misty Glow Ct
- 7252 Tigertail Ct
- 7908 Elk Stone Ave
- 7305 Bosky Springs St
- 7817 Falconwing Ave
- 7813 Falconwing Ave
- 7228 Buglehorn St
- 7812 Sparrowgate Ave
- 7816 Purple Mountain Ave
- 8005 Exploration Ave
- 7413 Red Eagle St
- 7925 High Stream Ave
- 8056 Broken Spur Ln
- 7732 Silver Mallard Ave
- 7133 Savory St
- 7717 White Grass Ave
- 7405 Painted Ridge St
- 7613 Falconwing Ave
- 7229 Robins Roost St
- 7749 Curiosity Ave
- 7300 Lost Shadow Ct Unit 2
- 7304 Lost Shadow Ct
- 7301 Lost Shadow Ct
- 7305 Lost Shadow Ct
- 7252 Lost Shadow Ct
- 7308 Lost Shadow Ct
- 7312 Lost Shadow Ct
- 7909 Canyon Grove Ct
- 7253 Lost Shadow Ct
- 7313 Lost Shadow Ct
- 7248 Lost Shadow Ct
- 7309 Lost Shadow Ct
- 7300 Wandering Star Ct
- 7908 Canyon Grove Ct
- 7249 Lost Shadow Ct
- 7308 Wandering Star Ct
- 7909 Mountain Point Ave
- 7252 Wandering Star Ct
- 7252 Wandering Star Ct Unit n/a