Estimated Value: $274,650 - $331,000
3
Beds
2
Baths
1,760
Sq Ft
$175/Sq Ft
Est. Value
About This Home
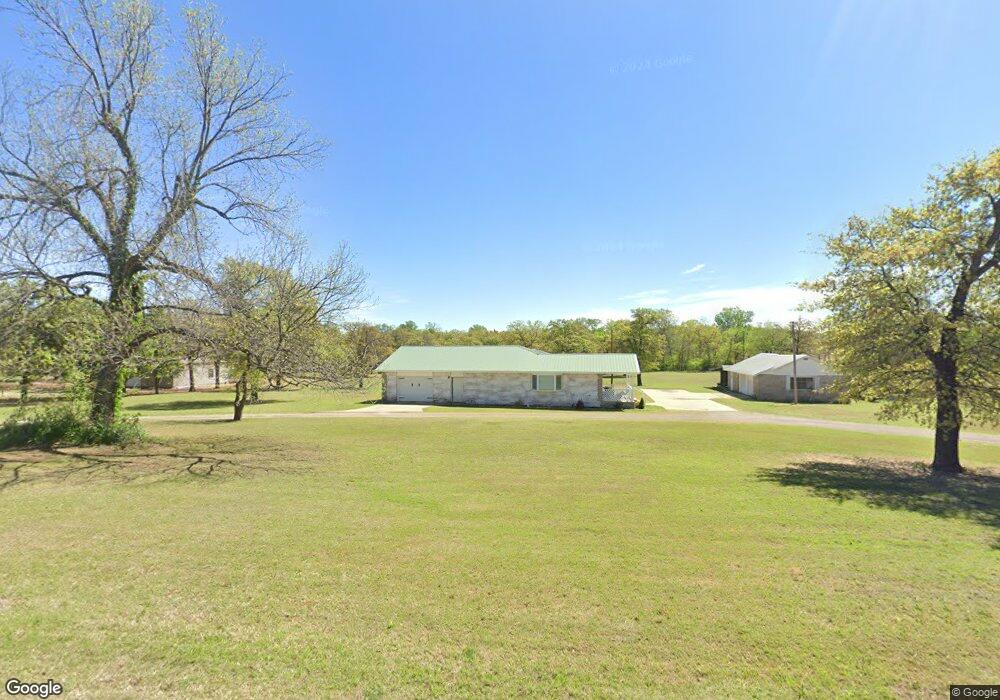
This home is located at 7300 Rolling Oaks Rd, Jones, OK 73049 and is currently estimated at $307,163, approximately $174 per square foot. 7300 Rolling Oaks Rd is a home located in Oklahoma County with nearby schools including Jones Elementary School, Jones Middle School, and Jones High School.
Ownership History
Date
Name
Owned For
Owner Type
Purchase Details
Closed on
Jul 8, 2015
Sold by
Walker J C J and Walker C J
Bought by
Rogers James
Current Estimated Value
Home Financials for this Owner
Home Financials are based on the most recent Mortgage that was taken out on this home.
Original Mortgage
$147,283
Outstanding Balance
$115,043
Interest Rate
3.91%
Mortgage Type
FHA
Estimated Equity
$192,120
Purchase Details
Closed on
Nov 21, 2013
Sold by
Walker J C
Bought by
Walker J C and J C Walker Living Trust
Purchase Details
Closed on
Jan 3, 2002
Sold by
Walker Victor Calvin and Walker Ilo Fayne
Bought by
Walker J C and Walker Glenda L
Home Financials for this Owner
Home Financials are based on the most recent Mortgage that was taken out on this home.
Original Mortgage
$60,000
Interest Rate
7.03%
Mortgage Type
Seller Take Back
Purchase Details
Closed on
Nov 11, 1998
Sold by
Wilson Steven M and Wilson Martha G
Bought by
Walker Victor Calvin and Walker Ilo Fayne
Create a Home Valuation Report for This Property
The Home Valuation Report is an in-depth analysis detailing your home's value as well as a comparison with similar homes in the area
Home Values in the Area
Average Home Value in this Area
Purchase History
| Date | Buyer | Sale Price | Title Company |
|---|---|---|---|
| Rogers James | $150,000 | Stewart-Ok City | |
| Walker J C | -- | None Available | |
| Walker J C | -- | -- | |
| Walker Victor Calvin | $67,500 | -- |
Source: Public Records
Mortgage History
| Date | Status | Borrower | Loan Amount |
|---|---|---|---|
| Open | Rogers James | $147,283 | |
| Previous Owner | Walker J C | $60,000 |
Source: Public Records
Tax History Compared to Growth
Tax History
| Year | Tax Paid | Tax Assessment Tax Assessment Total Assessment is a certain percentage of the fair market value that is determined by local assessors to be the total taxable value of land and additions on the property. | Land | Improvement |
|---|---|---|---|---|
| 2024 | $2,083 | $20,072 | $2,252 | $17,820 |
| 2023 | $2,083 | $19,488 | $2,529 | $16,959 |
| 2022 | $1,952 | $18,921 | $2,738 | $16,183 |
| 2021 | $1,932 | $18,370 | $1,918 | $16,452 |
| 2020 | $1,991 | $18,810 | $1,918 | $16,892 |
| 2019 | $1,995 | $18,297 | $1,882 | $16,415 |
| 2018 | $1,949 | $17,765 | $0 | $0 |
| 2017 | $1,921 | $17,654 | $1,037 | $16,617 |
| 2016 | $1,885 | $17,269 | $1,037 | $16,232 |
| 2015 | $1,234 | $12,156 | $827 | $11,329 |
| 2014 | $1,252 | $12,156 | $872 | $11,284 |
Source: Public Records
Map
Nearby Homes
- 14040 NE 63rd St
- 0 W Wilshire Blvd Unit 1178902
- 6001 Sandyhill Rd
- 0 E Wilshire Blvd
- 6485 Fawn Ridge
- 6600 N Choctaw Rd
- 421 Sweetbough St
- 409 Sweetbough St
- 813 SW 4th St
- 137 SW 2nd St
- 613 Montana St
- 617 Louisiana St
- 635 SW 6th St
- 113 Alabama
- 119 Alabama
- 306 W Cherokee St
- 0 N Hiwassee Rd
- 12990 Montana St
- 17200 N Choctaw Rd
- 1 N Choctaw Rd
- 7650 Rolling Oaks Rd
- 7555 Rolling Oaks Rd
- 7565 Rolling Oaks Rd
- 7662 Rolling Oaks Rd
- 7295 Rolling Oaks Rd
- 7210 Rolling Oaks Rd
- 7650 Oakwood Way
- 7671 Rolling Oaks Rd
- 7201 Rolling Oaks Rd
- 14675 NE 71st St
- 7701 Rolling Oaks Rd
- 7790 Rolling Oaks Rd
- 14510 E Wilshire Blvd
- 14471 Teresa Dr
- 14670 NE 71st St
- 14700 NE 71st St
- 14703 E Wilshire Blvd
- 7720 Oakwood Way
- 14435 Teresa Dr
- 14480 Teresa Dr