
7301 Avenue 424 Dinuba, CA 93618
Estimated payment $8,258/month
Total Views
12,347
12.04
Acres
$124,169
Price per Acre
524,462
Sq Ft Lot
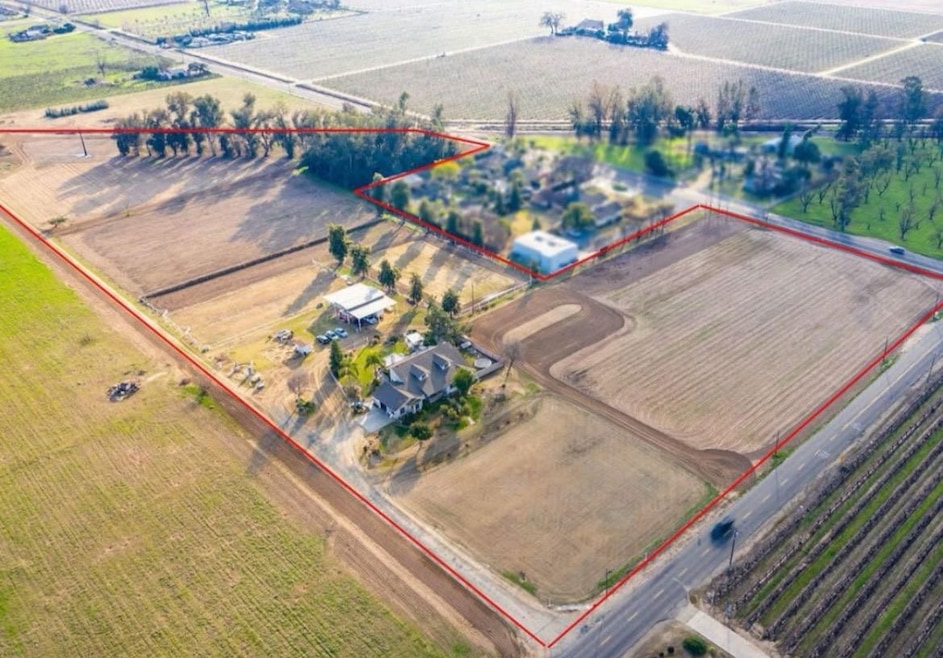
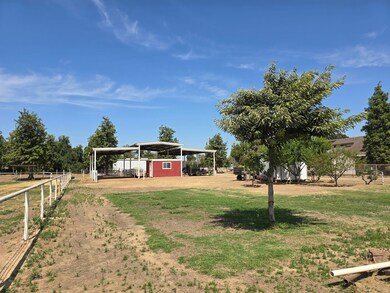
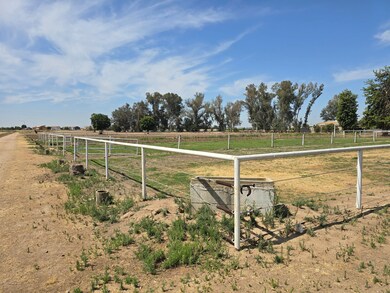
About This Lot
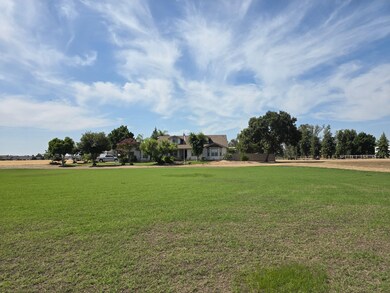
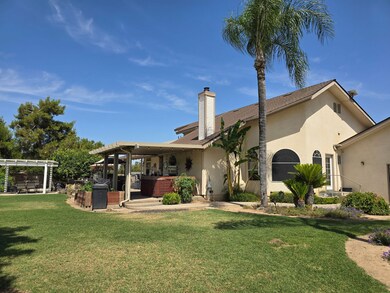
This beautiful home and land opportunity is located in the Dinuba City Limits. The property is currently zoned (R 1-10) Family Residential in the City of Dinuba Zone Plan. The buyer of this property could live in the home and potentially farm the land while waiting for the benefits of future
residential development. Dinuba does have residential development on both streets where this prime corner property is located. The land has access to Alta District water, a domestic pump/well and an Ag pump/well that is not currently operating. The parcel also borders city water and
sewer on the southeast property line.
Listing Provided By

Property Details
Property Type
- Land
Est. Annual Taxes
- $4,544
Lot Details
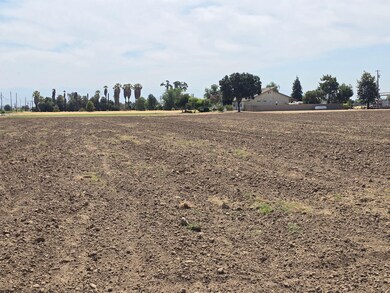
- Current uses include agriculture, residential single, orchard, livestock, irrigation
- Potential uses include agriculture, orchards/vineyards, residential single
Utilities
- 2 Water Wells
Map
Create a Home Valuation Report for This Property
The Home Valuation Report is an in-depth analysis detailing your home's value as well as a comparison with similar homes in the area
Home Values in the Area
Average Home Value in this Area
Tax History
| Year | Tax Paid | Tax Assessment Tax Assessment Total Assessment is a certain percentage of the fair market value that is determined by local assessors to be the total taxable value of land and additions on the property. | Land | Improvement |
|---|---|---|---|---|
| 2025 | $4,544 | $365,826 | $33,950 | $331,876 |
| 2024 | $4,544 | $358,654 | $33,285 | $325,369 |
| 2023 | $4,481 | $351,623 | $32,633 | $318,990 |
| 2022 | $4,319 | $344,730 | $31,994 | $312,736 |
| 2021 | $3,822 | $337,971 | $31,367 | $306,604 |
| 2020 | $3,910 | $334,505 | $31,045 | $303,460 |
| 2019 | $3,699 | $327,946 | $30,436 | $297,510 |
| 2018 | $3,595 | $321,515 | $29,839 | $291,676 |
| 2017 | $3,532 | $315,211 | $29,254 | $285,957 |
Source: Public Records
Property History
| Date | Event | Price | List to Sale | Price per Sq Ft |
|---|---|---|---|---|
| 10/01/2025 10/01/25 | Price Changed | $1,495,000 | -7.7% | $3 / Sq Ft |
| 07/21/2025 07/21/25 | For Sale | $1,620,000 | -- | $3 / Sq Ft |
Purchase History
| Date | Type | Sale Price | Title Company |
|---|---|---|---|
| Interfamily Deed Transfer | -- | Chicago Title Co | |
| Grant Deed | -- | Chicago Title |
Source: Public Records
Mortgage History
| Date | Status | Loan Amount | Loan Type |
|---|---|---|---|
| Closed | $223,000 | No Value Available |
Source: Public Records
Nearby Homes
- 1513 Crimson Way Unit Lot 4
- 1484 Concord Way Unit Lt 37
- Lot 69 1815 W Rosemary Ave
- 1473 Concord Way Unit LT 41
- 1473 Concord Way Unit Lot 41
- 1444 Crimson Way #Lot 50
- 1484 Concord Lot 37 Way
- 1513 Crimson Way Lt #4
- Lot 71 1863 W Rosemary Ave
- 1512 Crimson Lot 46 Way
- MB90 N Skye St
- 42682 Road 72
- 1306 Country Place
- 755 N Plum Ct
- 733 N Plum Ct
- Hawthorne Plan at Montebella
- Kipling Plan at Montebella
- Henley Plan at Montebella
- Ashford Plan at Montebella
- Walden Plan at Montebella
- 497 E North Way
- 1257 Ridge Creek Estates Way
- 683 N Haney Ave
- 560 E Adams Ave
- 3062 19th Ave
- 2500 14th Ave Unit J
- 901 Harold St
- 780 Lake St
- 3670 Mccall Ave
- 1530 Edgar Ave Unit 102
- 1431 Hoag Ave
- 7902 Clinton Ave
- 3100 N Akers St
- 31100 Ruth Hill Rd
- 6710 W Doe Ave
- 2964 Arundel Way Unit 2964-A
- 1842 W Robin Ave
- 300 E Shannon Pkwy
- 38227 Squaw Valley Rd
- 4620 W Douglas Ave