7301 Spring Vista Ct Unit 27278 Chapel Hill, NC 27516
Estimated Value: $828,402 - $1,060,000
4
Beds
3
Baths
2,874
Sq Ft
$324/Sq Ft
Est. Value
About This Home
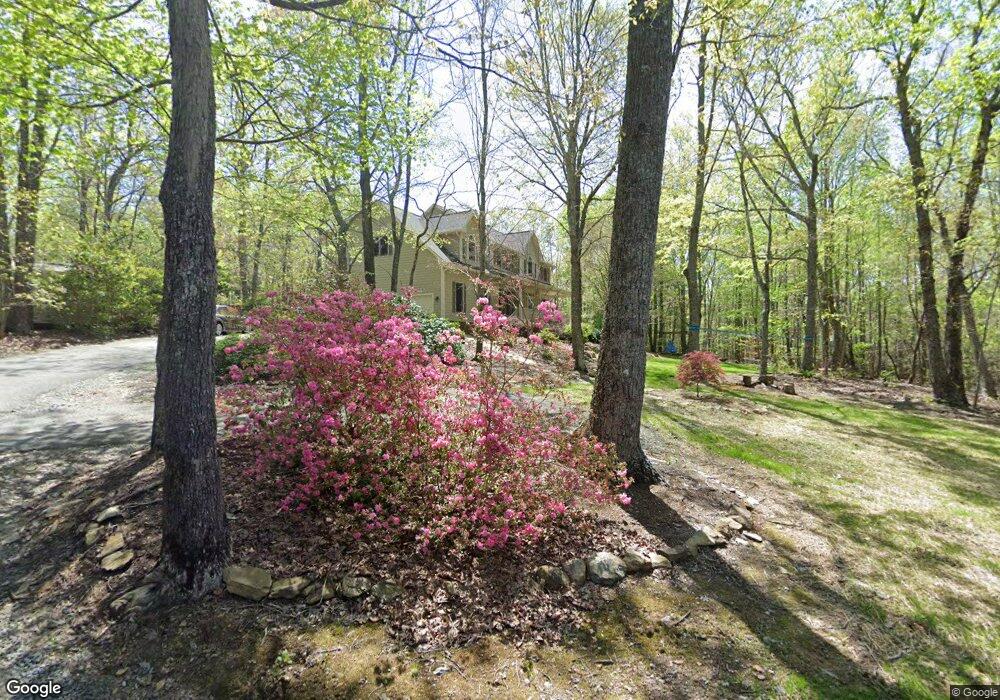
This home is located at 7301 Spring Vista Ct Unit 27278, Chapel Hill, NC 27516 and is currently estimated at $930,101, approximately $323 per square foot. 7301 Spring Vista Ct Unit 27278 is a home located in Orange County with nearby schools including Morris Grove Elementary School, McDougle Middle School, and Chapel Hill High School.
Ownership History
Date
Name
Owned For
Owner Type
Purchase Details
Closed on
Jun 22, 2017
Sold by
Stauber Timothy B and Stauber Bethany L
Bought by
Frazier Richard Patrick and Iselin Anne Marie
Current Estimated Value
Home Financials for this Owner
Home Financials are based on the most recent Mortgage that was taken out on this home.
Original Mortgage
$399,900
Outstanding Balance
$331,902
Interest Rate
3.94%
Mortgage Type
New Conventional
Estimated Equity
$598,199
Purchase Details
Closed on
Aug 5, 2010
Sold by
Oluanaigh William B and Oluanaigh Paige H
Bought by
Stauber Timothy B and Stauber Bethany L
Home Financials for this Owner
Home Financials are based on the most recent Mortgage that was taken out on this home.
Original Mortgage
$376,000
Interest Rate
4.7%
Mortgage Type
New Conventional
Purchase Details
Closed on
Jul 30, 2004
Sold by
Stapel Craig and Stapel Maureen
Bought by
Oluanaigh William B and Oluanaigh Paige H
Create a Home Valuation Report for This Property
The Home Valuation Report is an in-depth analysis detailing your home's value as well as a comparison with similar homes in the area
Home Values in the Area
Average Home Value in this Area
Purchase History
| Date | Buyer | Sale Price | Title Company |
|---|---|---|---|
| Frazier Richard Patrick | $500,000 | None Available | |
| Stauber Timothy B | $470,000 | None Available | |
| Oluanaigh William B | $400,000 | -- |
Source: Public Records
Mortgage History
| Date | Status | Borrower | Loan Amount |
|---|---|---|---|
| Open | Frazier Richard Patrick | $399,900 | |
| Previous Owner | Stauber Timothy B | $376,000 | |
| Previous Owner | Stauber Timothy B | $23,500 |
Source: Public Records
Tax History Compared to Growth
Tax History
| Year | Tax Paid | Tax Assessment Tax Assessment Total Assessment is a certain percentage of the fair market value that is determined by local assessors to be the total taxable value of land and additions on the property. | Land | Improvement |
|---|---|---|---|---|
| 2025 | $7,158 | $819,900 | $300,000 | $519,900 |
| 2024 | $6,371 | $545,000 | $175,000 | $370,000 |
| 2023 | $5,885 | $514,600 | $175,000 | $339,600 |
| 2022 | $5,735 | $514,600 | $175,000 | $339,600 |
| 2021 | $5,619 | $514,600 | $175,000 | $339,600 |
| 2020 | $5,731 | $491,200 | $175,000 | $316,200 |
| 2018 | $5,511 | $480,100 | $175,000 | $305,100 |
| 2017 | $6,057 | $472,800 | $175,000 | $297,800 |
| 2016 | $6,057 | $514,520 | $133,739 | $380,781 |
| 2015 | $6,005 | $514,520 | $133,739 | $380,781 |
| 2014 | $5,985 | $514,520 | $133,739 | $380,781 |
Source: Public Records
Map
Nearby Homes
- 1841 Dots Dr
- 1005 Wood Sage Dr
- 1040 Millbrook Cir
- 3217 Wood Duck Ln Unit 27278
- 1134 Millbrook Cir
- Lot 4a Millbrook Cir
- 4b Millbrook Cir
- Lot 1c Millbrook Cir
- 2b Millbrook Cir
- 1001 Arthur Minnis Rd
- 2307 Pickard Mountain Rd
- 8095 Old Nc 86
- 287 Twisted Oak Way
- 804 Long Meadows Rd
- 1909 Jo Mac Rd
- 102 Shadow Ridge Place
- TBD Montgomery Estates Rd
- 811 Oxbow Crossing Rd
- 8780 Old Nc 86
- Tbd Lot 10 Montgomery Estates Rd
- 7303 Spring Vista Ct
- 7111 Crescent Ridge Dr
- 7119 Crescent Ridge Dr
- 7306 Spring Vista Ct
- 7103 Crescent Ridge Dr
- 7203 Crescent Ridge Dr
- Lot B Spring Vista Ct
- 000 Spring Vista Ct
- 7101 Crescent Ridge Dr
- 7112 Crescent Ridge Dr
- 7120 Crescent Ridge Dr
- 2639 Dairyland Rd
- 7106 Crescent Ridge Dr
- 7217 Crescent Ridge Dr
- 7300 Spring Vista Ct
- 7202 Crescent Ridge Dr
- 7100 Crescent Ridge Dr
- 7315 Crescent Ridge Dr Unit 27516
- 7216 Crescent Ridge Dr
- 7323 Crescent Ridge Dr Unit 27516