NOT LISTED FOR SALE

7302 Basalt Dr Union City, GA 30291

Estimated Value: $325,000 - $360,000

4 Beds
3 Baths
2,759 Sq Ft
$122/Sq Ft Est. Value

Last Sold December 12, 2017

Last sale price $175,000 $63 Per Sq Ft

Est. 93% increase in value since last sale

Current estimated payment $2,260/month

About This Home

As of December 2017

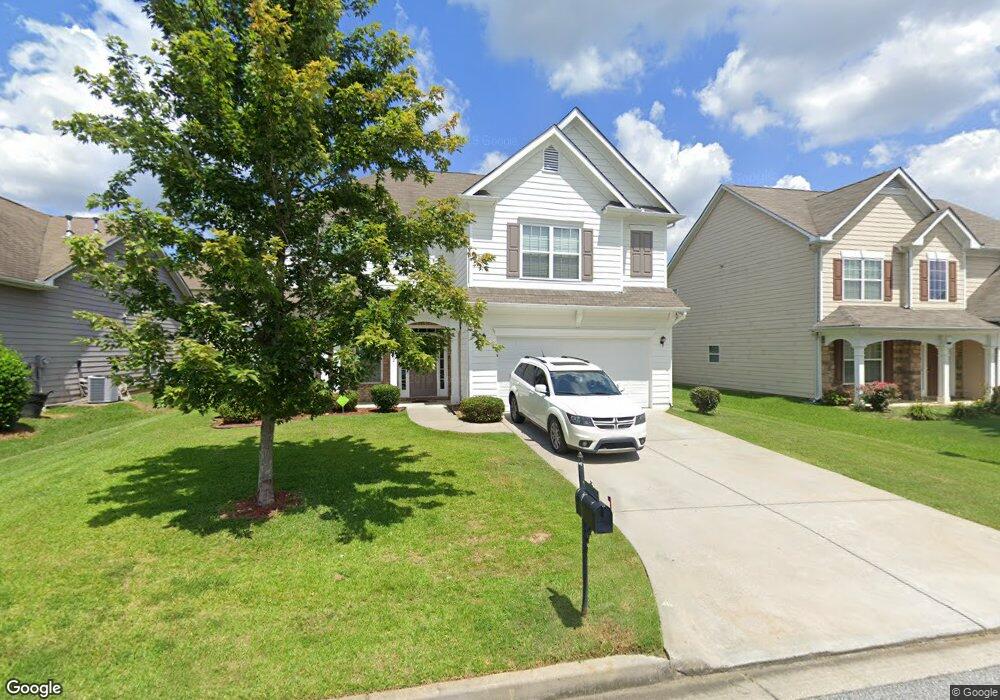
Beautiful 4 bedroom 2.5 bath home. This home boasts living room/dining room combination, kitchen with Corian countertops and
Black Stainless Steel appliances. New carpet and tile floors can be found throughout the home. The kitchen breakfast area opens into the family
room with gas fireplace. Oversized bedrooms on 2nd level with walk-in closet. Backyard in leveled and fenced. Great for entertaining! Home has
easy access to the highway, shopping and area amenities. A must see!

Ownership History

Date Name Owned For Owner Type

Purchase Details

Listed on
Nov 8, 2017
Closed on
Dec 12, 2017
Sold by
Boutte Michael
Bought by
Cerberus Sfr Holdings Lp
Seller's Agent
DEBORAH TINSLEY
Century 21 Connect Realty
Buyer's Agent
Justin Bell
Prestige Brokers Group, LLC.
List Price
$185,000
Sold Price
$175,000
Premium/Discount to List
-$10,000
-5.41%
Current Estimated Value
$337,438

Home Financials for this Owner

Home Financials are based on the most recent Mortgage that was taken out on this home.
Estimated Appreciation
$162,438
Avg. Annual Appreciation
8.75%
Source: Public Records

Range of Values:

Collateral Analytics

Collateral Analytics Collateral Analytics AVMs (Automated Valuation Model) employ a number of statistical approaches combined with neighborhood-specific comparable selection guarantees the most up-to-date and precise valuations.

Not Available

Collateral Analytics does not have data for the current month. Please view the chart for historical values.

ICE

ICE Mortgage Technology ICE Mortgage Technology’s AVM (Automated Valuation Model) is a state-of-the-art online residential property valuation tool that provides a quick and accurate estimate of the value of almost any home in the U.S.

Not Available

ICE Mortgage Technology does not have data for the current month. Please view the chart for historical values.

First American

First American First American Data & Analytics’ next-generation AVM combines unrivaled data assets with a blended ensemble of valuation models to produce highly accurate, reliable valuations you can trust.

Not Available

First American does not have data for the current month. Please view the chart for historical values.

Quantarium

Quantarium Quantarium’s valuation service, repeatedly proven the industry’s most accurate and comprehensive, is supercharged with a self-learning and auto-tuning AI engine that continually becomes smarter and more accurate as it processes daily inputs from the industry’s leading RE data lake.

Not Available

Quantarium does not have data for the current month. Please view the chart for historical values.

Average Value
Not Available
List Price
Sold Price
Create a Home Valuation Report for This Property
The Home Valuation Report is an in-depth analysis detailing your home's value as well as a comparison with similar homes in the area

Home Values in the Area

Source: Public Records

Average Home Value in this Area


Source: Public Records

Purchase History

Date Buyer Sale Price Title Company
Cerberus Sfr Holdings Lp $175,000 --
Source: Public Records

Property History

Date Event Price List to Sale Price per Sq Ft Prior Sale
12/12/2017 12/12/17 Sold $175,000 -5.4% $63 / Sq Ft View Prior Sale
11/08/2017 11/08/17 For Sale $185,000 -- $67 / Sq Ft

Tax History Compared to Growth

Source: Public Records

Tax History

Year Tax Paid Tax Assessment Tax Assessment Total Assessment is a certain percentage of the fair market value that is determined by local assessors to be the total taxable value of land and additions on the property. Land Improvement
2025 $5,069 $131,600 $38,720 $92,880
2023 $3,715 $131,600 $38,720 $92,880
2022 $3,066 $78,200 $10,720 $67,480
2021 $3,130 $78,200 $10,720 $67,480
2020 $2,705 $78,200 $10,720 $67,480
2019 $2,765 $70,000 $9,440 $60,560
2018 $2,723 $68,400 $9,240 $59,160
2017 $2,947 $72,320 $15,240 $57,080
2016 $2,948 $72,320 $15,240 $57,080
2015 $2,957 $72,320 $15,240 $57,080
2014 $2,634 $61,080 $11,880 $49,200
Source: Public Records

Agents Affiliated with this Home

  • Section Image
  • Section Image
See All Agents

Map