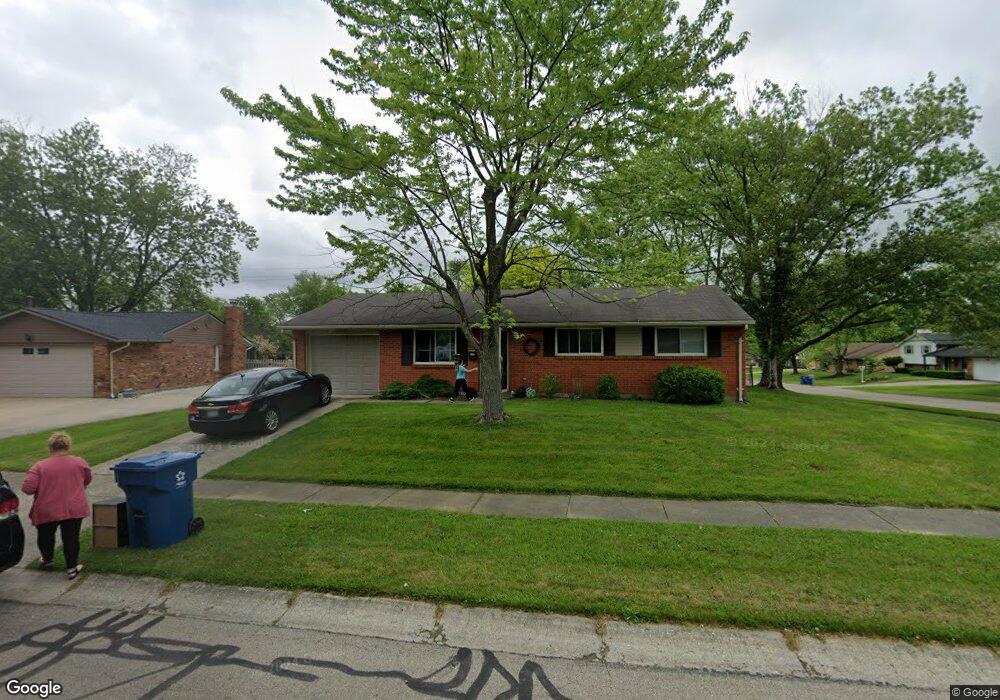
7302 Chatlake Dr Dayton, OH 45424
Estimated Value: $166,000 - $182,000
3
Beds
1
Bath
999
Sq Ft
$171/Sq Ft
Est. Value
About This Home
This home is located at 7302 Chatlake Dr, Dayton, OH 45424 and is currently estimated at $171,281, approximately $171 per square foot. 7302 Chatlake Dr is a home located in Montgomery County with nearby schools including Wayne High School and Huber Heights Christian Academy.
Ownership History
Date
Name
Owned For
Owner Type
Purchase Details
Closed on
Nov 29, 2018
Sold by
Markham James G and Markham Lisa E
Bought by
Nickels Teresa F
Current Estimated Value
Home Financials for this Owner
Home Financials are based on the most recent Mortgage that was taken out on this home.
Original Mortgage
$82,875
Outstanding Balance
$74,323
Interest Rate
6.12%
Mortgage Type
FHA
Estimated Equity
$96,958
Purchase Details
Closed on
Mar 25, 1998
Sold by
Olinger William D and Olinger Rhoda L
Bought by
Markham James G and Markham Lisa E
Home Financials for this Owner
Home Financials are based on the most recent Mortgage that was taken out on this home.
Original Mortgage
$59,100
Interest Rate
7.5%
Purchase Details
Closed on
Nov 12, 1993
Sold by
Olinger Phillip W
Bought by
Olinger William D and Olinger Rhoda L
Create a Home Valuation Report for This Property
The Home Valuation Report is an in-depth analysis detailing your home's value as well as a comparison with similar homes in the area
Home Values in the Area
Average Home Value in this Area
Purchase History
| Date | Buyer | Sale Price | Title Company |
|---|---|---|---|
| Nickels Teresa F | $90,500 | Safemark Title Agency Inc | |
| Markham James G | $73,900 | -- | |
| Markham James G | $73,900 | -- | |
| Olinger William D | -- | -- |
Source: Public Records
Mortgage History
| Date | Status | Borrower | Loan Amount |
|---|---|---|---|
| Open | Nickels Teresa F | $82,875 | |
| Previous Owner | Markham James G | $59,100 |
Source: Public Records
Tax History
| Year | Tax Paid | Tax Assessment Tax Assessment Total Assessment is a certain percentage of the fair market value that is determined by local assessors to be the total taxable value of land and additions on the property. | Land | Improvement |
|---|---|---|---|---|
| 2025 | $2,350 | $42,770 | $10,150 | $32,620 |
| 2024 | $2,272 | $42,770 | $10,150 | $32,620 |
| 2023 | $2,272 | $42,770 | $10,150 | $32,620 |
| 2022 | $1,982 | $29,470 | $7,000 | $22,470 |
| 2021 | $2,016 | $29,470 | $7,000 | $22,470 |
| 2020 | $2,018 | $29,470 | $7,000 | $22,470 |
| 2019 | $2,047 | $26,460 | $7,000 | $19,460 |
| 2018 | $2,054 | $26,460 | $7,000 | $19,460 |
| 2017 | $2,042 | $26,460 | $7,000 | $19,460 |
| 2016 | $1,939 | $24,460 | $7,000 | $17,460 |
| 2015 | $1,915 | $24,460 | $7,000 | $17,460 |
| 2014 | $1,915 | $24,460 | $7,000 | $17,460 |
| 2012 | -- | $26,540 | $8,750 | $17,790 |
Source: Public Records
Map
Nearby Homes
- 7424 Chatlake Dr
- 7515 Beldale Ave
- 7302 Belle Plain Dr
- 7237 Carmelita Dr
- 7100 Chatlake Dr
- 7201 Belle Plain Dr
- 7250 Robindale St
- 7317 Cosner Dr
- 7368 San Fernando Rd
- 7000 Taylorsville Rd
- 6822 Wintergreen Place
- 6809 Wintergreen Place
- 7621 Shalamar Dr
- 7178 Ballauer Place
- 7507 Chambersburg Rd
- 6508 Hemingway Rd
- 7821 Wedgemere Cir
- 6105 Leyden Ln Unit 136105
- 6730 Alter Rd
- 7401 Ballauer Place
- 7320 Chatlake Dr
- 7238 Chatlake Dr
- 7521 Mark Ave
- 7495 Cedar Knolls Dr
- 7301 Chatlake Dr
- 7336 Chatlake Dr
- 7337 Chatlake Dr
- 7228 Chatlake Dr
- 7520 Mark Ave
- 7541 Mark Ave
- 7485 Cedar Knolls Dr
- 7348 Chatlake Dr
- 7540 Mark Ave
- 7361 Chatlake Dr
- 7218 Chatlake Dr
- 7494 Cedar Knolls Dr
- 7475 Cedar Knolls Dr
- 7360 Chatlake Dr
- 7484 Cedar Knolls Dr
- 7565 Mark Ave
Your Personal Tour Guide
Ask me questions while you tour the home.