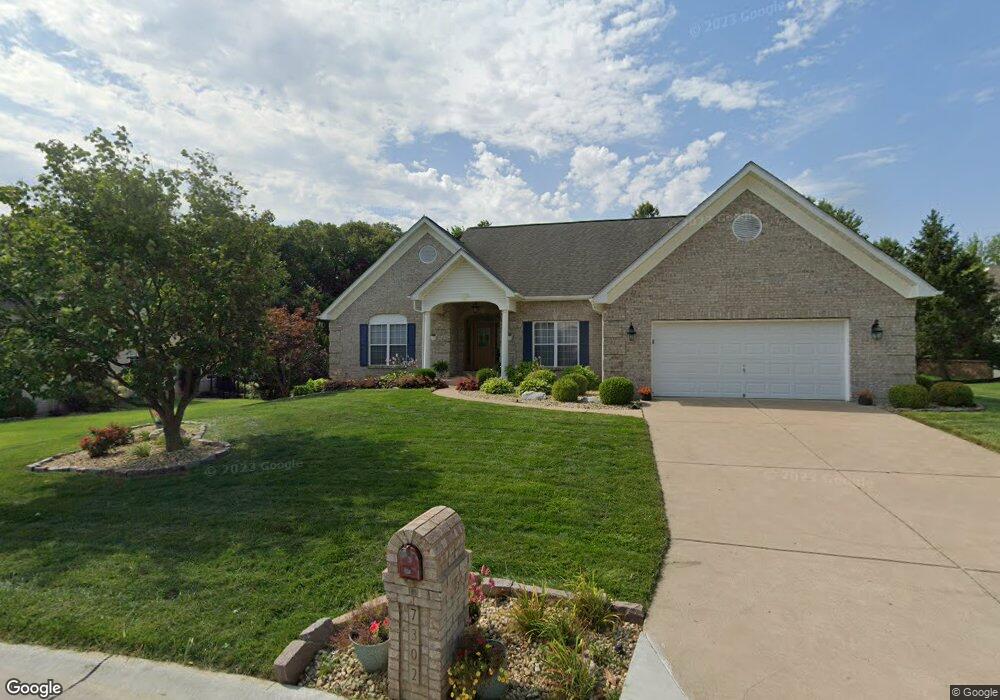
7302 Westfield Crossing O Fallon, MO 63368
Estimated Value: $542,000 - $670,000
3
Beds
3
Baths
2,194
Sq Ft
$265/Sq Ft
Est. Value
About This Home
This home is located at 7302 Westfield Crossing, O Fallon, MO 63368 and is currently estimated at $582,091, approximately $265 per square foot. 7302 Westfield Crossing is a home located in St. Charles County with nearby schools including John Weldon Elementary School, Francis Howell Middle School, and Francis Howell Union High School.
Ownership History
Date
Name
Owned For
Owner Type
Purchase Details
Closed on
Mar 2, 2022
Sold by
Jakse and Elizabeth
Bought by
Jakse Living Trust
Current Estimated Value
Purchase Details
Closed on
Apr 20, 2006
Sold by
Wargin Richard W and Wargin Donna J
Bought by
Jakse Frank and Jakse Elizabeth
Home Financials for this Owner
Home Financials are based on the most recent Mortgage that was taken out on this home.
Original Mortgage
$220,000
Interest Rate
6.12%
Mortgage Type
Fannie Mae Freddie Mac
Purchase Details
Closed on
Apr 21, 1998
Sold by
Arbor Homes Inc
Bought by
Wargin Richard W and Wargin Donna J
Home Financials for this Owner
Home Financials are based on the most recent Mortgage that was taken out on this home.
Original Mortgage
$247,300
Interest Rate
7.21%
Mortgage Type
Assumption
Purchase Details
Closed on
Oct 3, 1997
Sold by
S & D Partnership
Bought by
Arbor Homes Inc
Home Financials for this Owner
Home Financials are based on the most recent Mortgage that was taken out on this home.
Original Mortgage
$205,218
Interest Rate
7.52%
Create a Home Valuation Report for This Property
The Home Valuation Report is an in-depth analysis detailing your home's value as well as a comparison with similar homes in the area
Home Values in the Area
Average Home Value in this Area
Purchase History
We collect this data history from publicly available records. To have your information removed, we recommend requesting removal directly through your county’s website.
| Date | Buyer | Sale Price | Title Company |
|---|---|---|---|
| Jakse Living Trust | -- | None Listed On Document | |
| Jakse Frank | $372,500 | Ust | |
| Wargin Richard W | -- | -- | |
| Arbor Homes Inc | -- | -- |
Source: Public Records
Mortgage History
We collect this data history from publicly available records. To have your information removed, we recommend requesting removal directly through your county’s website.
| Date | Status | Borrower | Loan Amount |
|---|---|---|---|
| Previous Owner | Jakse Frank | $220,000 | |
| Previous Owner | Wargin Richard W | $247,300 | |
| Previous Owner | Arbor Homes Inc | $205,218 |
Source: Public Records
Tax History
| Year | Tax Paid | Tax Assessment Tax Assessment Total Assessment is a certain percentage of the fair market value that is determined by local assessors to be the total taxable value of land and additions on the property. | Land | Improvement |
|---|---|---|---|---|
| 2025 | $5,080 | $92,366 | -- | -- |
| 2023 | $5,078 | $84,008 | $0 | $0 |
| 2022 | $4,248 | $65,184 | $0 | $0 |
| 2021 | $4,252 | $65,184 | $0 | $0 |
| 2020 | $4,219 | $62,583 | $0 | $0 |
| 2019 | $4,200 | $62,583 | $0 | $0 |
| 2018 | $4,544 | $64,784 | $0 | $0 |
| 2017 | $4,507 | $64,784 | $0 | $0 |
| 2016 | $4,381 | $60,626 | $0 | $0 |
| 2015 | $4,344 | $60,626 | $0 | $0 |
| 2014 | $4,112 | $55,664 | $0 | $0 |
Source: Public Records
Map
Nearby Homes
- 1600 Valley Hill Ct
- 7052 Black Horse Dr
- 119 Riparian Ct
- 7053 Black Horse Dr
- 432 White Chapel Dr
- 456 White Chapel Dr
- 987 Bentley Park Cir
- 57 Burgundy Place Dr
- 6915 Fieldstone Farms Dr
- 1181 Regents Ct
- 7230 Cinnamon Teal Dr
- 816 Aston Way Dr
- 104 Haven Ridge Ct
- 2 Wing Stem Ct
- 8046 Knights Crossing Dr
- 218 Brook Ln
- 157 Haven Ridge Ct
- 101 Haven Ridge Ct Unit LOT 47
- 149 Haven Ridge Ct
- 140 Haven Ridge Ct
- 7228 Westfield Woods Dr
- 7331 Spruce Hill Ct
- 7303 Westfield Crossing
- 7230 Westfield Woods Dr
- 7220 S Ridgetop Ct
- 7224 S Ridgetop Ct
- 7333 Spruce Hill Ct
- 7229 Westfield Woods Dr
- 7306 Westfield Crossing
- 1601 Valley Hill Ct
- 7232 Westfield Woods Dr
- 1603 Valley Hill Ct
- 1504 Westfield Cir
- 7218 S Ridgetop Ct
- 7335 Spruce Hill Ct
- 7231 Westfield Woods Dr
- 7308 Westfield Crossing
- 1512 Westfield Cir
- 7234 Westfield Woods Dr
- 1605 Valley Hill Ct
Your Personal Tour Guide
Ask me questions while you tour the home.