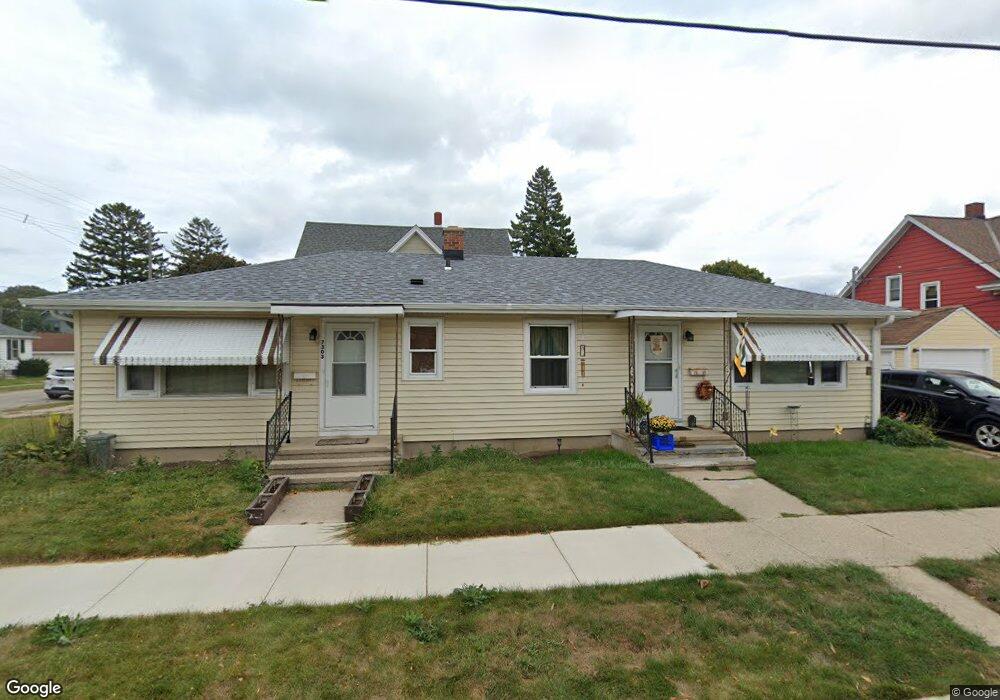
7303 28th Ave Kenosha, WI 53143
Saint Joes NeighborhoodEstimated Value: $203,754 - $256,000
3
Beds
2
Baths
1,430
Sq Ft
$163/Sq Ft
Est. Value
About This Home
This home is located at 7303 28th Ave, Kenosha, WI 53143 and is currently estimated at $232,689, approximately $162 per square foot. 7303 28th Ave is a home located in Kenosha County with nearby schools including Grewenow Elementary School, Lincoln Middle School, and Tremper High School.
Ownership History
Date
Name
Owned For
Owner Type
Purchase Details
Closed on
Nov 8, 2019
Sold by
Sorenson Trust
Bought by
Bareika Kyle and Collins Nancy
Current Estimated Value
Home Financials for this Owner
Home Financials are based on the most recent Mortgage that was taken out on this home.
Original Mortgage
$104,000
Outstanding Balance
$91,584
Interest Rate
3.65%
Mortgage Type
New Conventional
Estimated Equity
$141,105
Purchase Details
Closed on
May 5, 2010
Sold by
Sorensen Kenneth D and Sorensen Mary J
Bought by
Sorensen Trust
Create a Home Valuation Report for This Property
The Home Valuation Report is an in-depth analysis detailing your home's value as well as a comparison with similar homes in the area
Home Values in the Area
Average Home Value in this Area
Purchase History
| Date | Buyer | Sale Price | Title Company |
|---|---|---|---|
| Bareika Kyle | $143,000 | None Available | |
| Sorensen Trust | $151,500 | -- |
Source: Public Records
Mortgage History
| Date | Status | Borrower | Loan Amount |
|---|---|---|---|
| Open | Bareika Kyle | $104,000 |
Source: Public Records
Tax History Compared to Growth
Tax History
| Year | Tax Paid | Tax Assessment Tax Assessment Total Assessment is a certain percentage of the fair market value that is determined by local assessors to be the total taxable value of land and additions on the property. | Land | Improvement |
|---|---|---|---|---|
| 2024 | $2,257 | $100,400 | $17,300 | $83,100 |
| 2023 | $2,257 | $100,400 | $17,300 | $83,100 |
| 2022 | $2,294 | $100,400 | $17,300 | $83,100 |
| 2021 | $2,344 | $100,400 | $17,300 | $83,100 |
| 2020 | $2,598 | $100,400 | $17,300 | $83,100 |
| 2019 | $2,426 | $97,100 | $17,300 | $79,800 |
| 2018 | $2,380 | $84,300 | $17,300 | $67,000 |
| 2017 | $2,257 | $84,300 | $17,300 | $67,000 |
| 2016 | $2,212 | $84,300 | $17,300 | $67,000 |
| 2015 | $2,458 | $90,100 | $19,300 | $70,800 |
| 2014 | $2,446 | $90,100 | $19,300 | $70,800 |
Source: Public Records
Map
Nearby Homes