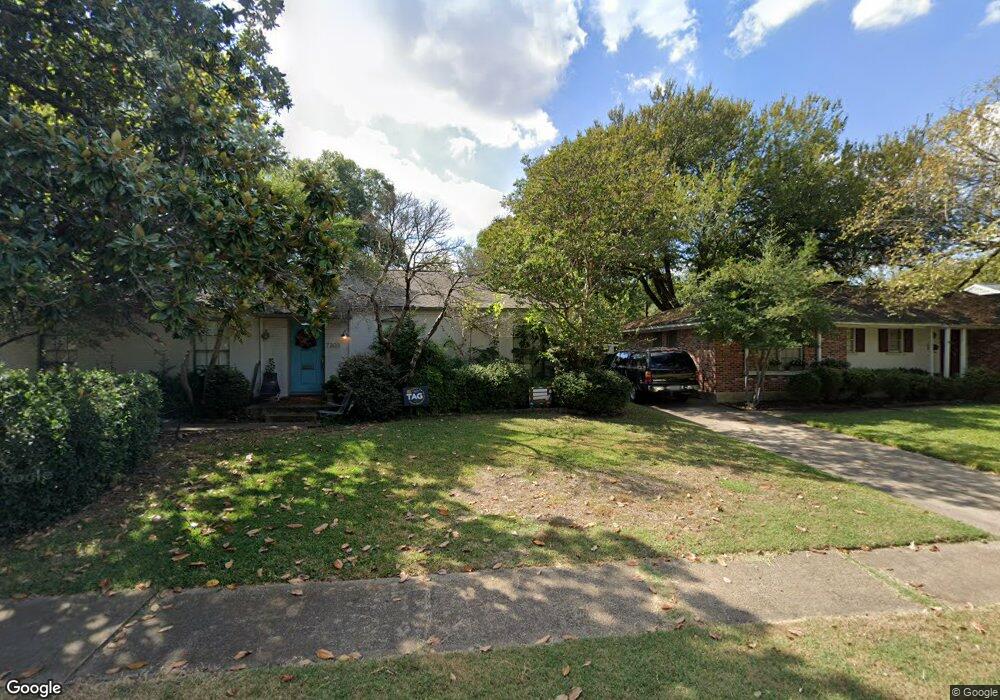
7303 Bucknell Dr Dallas, TX 75214
Northeast Dallas NeighborhoodEstimated Value: $738,000 - $850,000
4
Beds
3
Baths
2,148
Sq Ft
$365/Sq Ft
Est. Value
About This Home
This home is located at 7303 Bucknell Dr, Dallas, TX 75214 and is currently estimated at $783,948, approximately $364 per square foot. 7303 Bucknell Dr is a home located in Dallas County with nearby schools including Lakewood Elementary School, J L Long Middle School, and Woodrow Wilson High School.
Ownership History
Date
Name
Owned For
Owner Type
Purchase Details
Closed on
Aug 3, 2017
Sold by
Gorsen Mitchell S and Gorsen Maureen F
Bought by
Carruth Meadows Llc
Current Estimated Value
Home Financials for this Owner
Home Financials are based on the most recent Mortgage that was taken out on this home.
Original Mortgage
$397,890
Outstanding Balance
$331,650
Interest Rate
3.92%
Mortgage Type
New Conventional
Estimated Equity
$452,298
Purchase Details
Closed on
May 12, 2017
Sold by
Williams Jennifer Stone and Williams Kirby
Bought by
Gorsen Mitchell S and Gorsen Maureen F
Purchase Details
Closed on
Jul 18, 2011
Sold by
Carrerea Dillard and Carrera Judith
Bought by
Williams Jennifer Stone and Williams Kirby
Home Financials for this Owner
Home Financials are based on the most recent Mortgage that was taken out on this home.
Original Mortgage
$239,763
Interest Rate
4.52%
Mortgage Type
FHA
Create a Home Valuation Report for This Property
The Home Valuation Report is an in-depth analysis detailing your home's value as well as a comparison with similar homes in the area
Home Values in the Area
Average Home Value in this Area
Purchase History
| Date | Buyer | Sale Price | Title Company |
|---|---|---|---|
| Carruth Meadows Llc | -- | None Available | |
| Gorsen Mitchell S | -- | Rattikin Title | |
| Williams Jennifer Stone | -- | Hftc |
Source: Public Records
Mortgage History
| Date | Status | Borrower | Loan Amount |
|---|---|---|---|
| Open | Carruth Meadows Llc | $397,890 | |
| Previous Owner | Williams Jennifer Stone | $239,763 |
Source: Public Records
Tax History Compared to Growth
Tax History
| Year | Tax Paid | Tax Assessment Tax Assessment Total Assessment is a certain percentage of the fair market value that is determined by local assessors to be the total taxable value of land and additions on the property. | Land | Improvement |
|---|---|---|---|---|
| 2025 | $15,243 | $728,960 | $400,000 | $328,960 |
| 2024 | $15,243 | $682,000 | $300,000 | $382,000 |
| 2023 | $15,243 | $637,000 | $300,000 | $337,000 |
| 2022 | $14,962 | $598,400 | $260,000 | $338,400 |
| 2021 | $13,646 | $517,300 | $260,000 | $257,300 |
| 2020 | $12,402 | $457,170 | $260,000 | $197,170 |
| 2019 | $13,008 | $457,170 | $260,000 | $197,170 |
| 2018 | $11,653 | $428,550 | $260,000 | $168,550 |
| 2017 | $9,289 | $341,610 | $240,000 | $101,610 |
| 2016 | $9,289 | $341,610 | $240,000 | $101,610 |
| 2015 | $6,366 | $298,730 | $185,000 | $113,730 |
| 2014 | $6,366 | $282,380 | $150,000 | $132,380 |
Source: Public Records
Map
Nearby Homes
- 7318 Rockhurst Dr
- 7328 Rockhurst Dr
- 7325 Rutgers Dr
- 6811 Patrick Dr
- 7220 Haverford Rd
- 6660 Santa Anita Dr
- 7127 E Mockingbird Ln
- 6665 Santa Anita Dr
- 7147 E Mockingbird Ln
- 6717 Pimlico Dr
- 6644 Santa Anita Dr
- 6984 Santa Barbara Dr
- 7329 Dalewood Ln
- 6925 Galemeadow Cir
- 6611 Highgate Ln
- 7130 Brookcove Ln
- 6742 E Northwest Hwy
- 6711 Vada Dr
- 6802 Vada Dr
- 6923 Inverness Ln
- 7309 Bucknell Dr
- 7221 Bucknell Dr
- 7315 Bucknell Dr
- 7217 Bucknell Dr
- 7308 Rockhurst Dr
- 7310 Bucknell Dr
- 7319 Bucknell Dr
- 7316 Bucknell Dr
- 7216 Bucknell Dr
- 7325 Bucknell Dr
- 7207 Bucknell Dr
- 7309 Rockhurst Dr
- 7320 Bucknell Dr
- 6846 Trammel Dr
- 7315 Rockhurst Dr
- 7334 Rockhurst Dr
- 7208 Bucknell Dr
- 7329 Bucknell Dr
- 7319 Rockhurst Dr
- 7330 Bucknell Dr