7305 Alderbrook Rd Tillamook, OR 97141
Estimated Value: $366,000 - $417,000
2
Beds
2
Baths
1,837
Sq Ft
$214/Sq Ft
Est. Value
About This Home
This home is located at 7305 Alderbrook Rd, Tillamook, OR 97141 and is currently estimated at $392,267, approximately $213 per square foot. 7305 Alderbrook Rd is a home located in Tillamook County with nearby schools including Tillamook High School.
Ownership History
Date
Name
Owned For
Owner Type
Purchase Details
Closed on
Jun 15, 2020
Sold by
Phipps Lisa M and Phipps Lisa Michele
Bought by
Phipps Lisa Michelde and Lane Robert Allen
Current Estimated Value
Home Financials for this Owner
Home Financials are based on the most recent Mortgage that was taken out on this home.
Original Mortgage
$215,000
Outstanding Balance
$150,454
Interest Rate
3%
Mortgage Type
New Conventional
Estimated Equity
$241,813
Purchase Details
Closed on
Mar 11, 2009
Sold by
Bank Of New York
Bought by
Phipps Lisa M
Home Financials for this Owner
Home Financials are based on the most recent Mortgage that was taken out on this home.
Original Mortgage
$185,714
Interest Rate
4.8%
Mortgage Type
Purchase Money Mortgage
Purchase Details
Closed on
Aug 30, 2008
Sold by
Hoffert Daniel G and Hoffert Barbara J
Bought by
Bank Of New York
Create a Home Valuation Report for This Property
The Home Valuation Report is an in-depth analysis detailing your home's value as well as a comparison with similar homes in the area
Home Values in the Area
Average Home Value in this Area
Purchase History
| Date | Buyer | Sale Price | Title Company |
|---|---|---|---|
| Phipps Lisa Michelde | -- | Servicelink | |
| Phipps Lisa M | $182,000 | First American | |
| Bank Of New York | $199,750 | Fidelity Natl Title Co Of Or |
Source: Public Records
Mortgage History
| Date | Status | Borrower | Loan Amount |
|---|---|---|---|
| Open | Phipps Lisa Michelde | $215,000 | |
| Previous Owner | Phipps Lisa M | $185,714 |
Source: Public Records
Tax History Compared to Growth
Tax History
| Year | Tax Paid | Tax Assessment Tax Assessment Total Assessment is a certain percentage of the fair market value that is determined by local assessors to be the total taxable value of land and additions on the property. | Land | Improvement |
|---|---|---|---|---|
| 2024 | $2,013 | $197,370 | $58,570 | $138,800 |
| 2023 | $2,001 | $191,630 | $56,860 | $134,770 |
| 2022 | $1,930 | $186,050 | $55,200 | $130,850 |
| 2021 | $1,873 | $180,640 | $53,590 | $127,050 |
| 2020 | $1,822 | $175,380 | $52,030 | $123,350 |
| 2019 | $1,777 | $170,280 | $50,510 | $119,770 |
| 2018 | $1,732 | $165,330 | $49,040 | $116,290 |
| 2017 | $1,689 | $160,520 | $47,610 | $112,910 |
| 2016 | $1,624 | $155,850 | $46,220 | $109,630 |
| 2015 | $1,593 | $151,320 | $44,870 | $106,450 |
| 2014 | $1,569 | $146,920 | $43,560 | $103,360 |
| 2013 | -- | $142,650 | $42,290 | $100,360 |
Source: Public Records
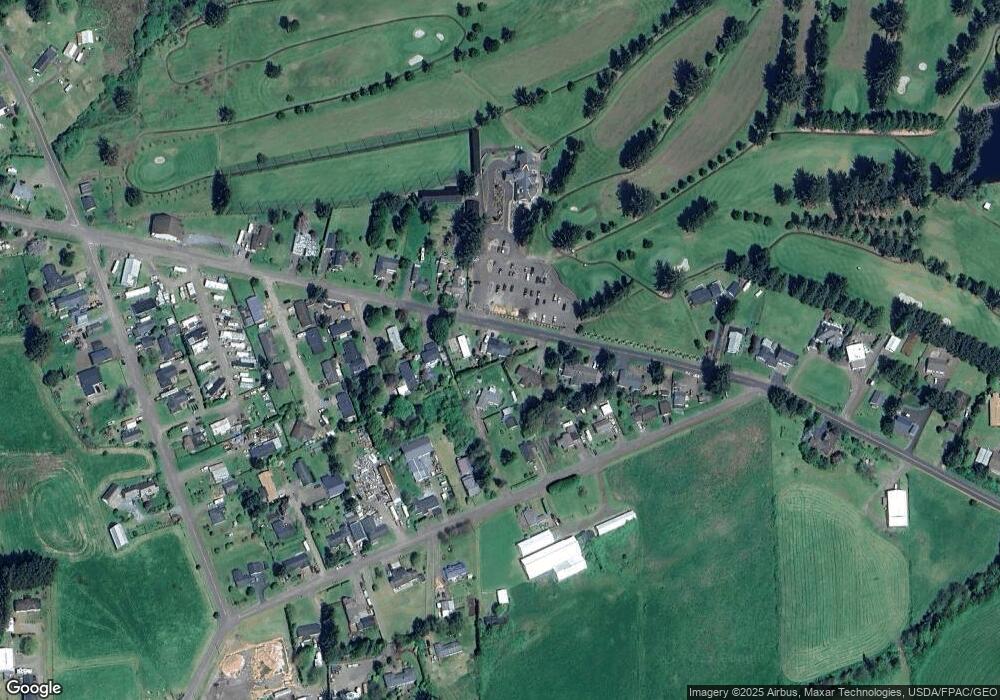
Map
Nearby Homes
- 4600 Idaville Rd Unit 36
- 7925 Doughty Rd
- 4000 Idaville Rd
- 7965 19th St
- 0 Willowbrook Dr Unit 2900 22130754
- 8095 Bewley St
- 7705 Seattle Ave
- 6825 Williams Ave
- VL Willowbrook Dr (Tl # 2900)
- T/L 4800 14th St
- TL#01302 Mccoy Ave
- 0 Mccoy Ave Unit 802 106415300
- 0 Mccoy Ave Unit 801 639312794
- 0 Mccoy Ave Unit 802 25-205
- 0 Mccoy Ave Unit 801 25-204
- 0 Clam St Unit 14 20110733
- 0 Clam St Unit 5 20410445
- 0 Clam St Unit 4 20207605
- 0 Clam St Unit 3 20473325
- 0 Clam St Unit 2 20453521
- 7315 Alderbrook Rd
- 7275 Alderbrook Rd
- 6050 Idaville Rd
- 7325 Alderbrook Rd
- 7320 Alderbrook Rd
- 7255 Alderbrook Rd
- 7345 Alderbrook Rd
- 7335 Alderbrook Rd
- 7330 Alderbrook Rd
- 6100 Idaville Rd
- 6200 Idaville Rd
- 6300 Idaville Rd
- 6000 Idaville Rd
- 7365 Alderbrook Rd
- 7225 Alderbrook Rd
- 7350 Alderbrook Rd
- 5900 Idaville Rd
- 7375 Alderbrook Rd
- 6400 Idaville Rd
- 7325 Kominoth Rd