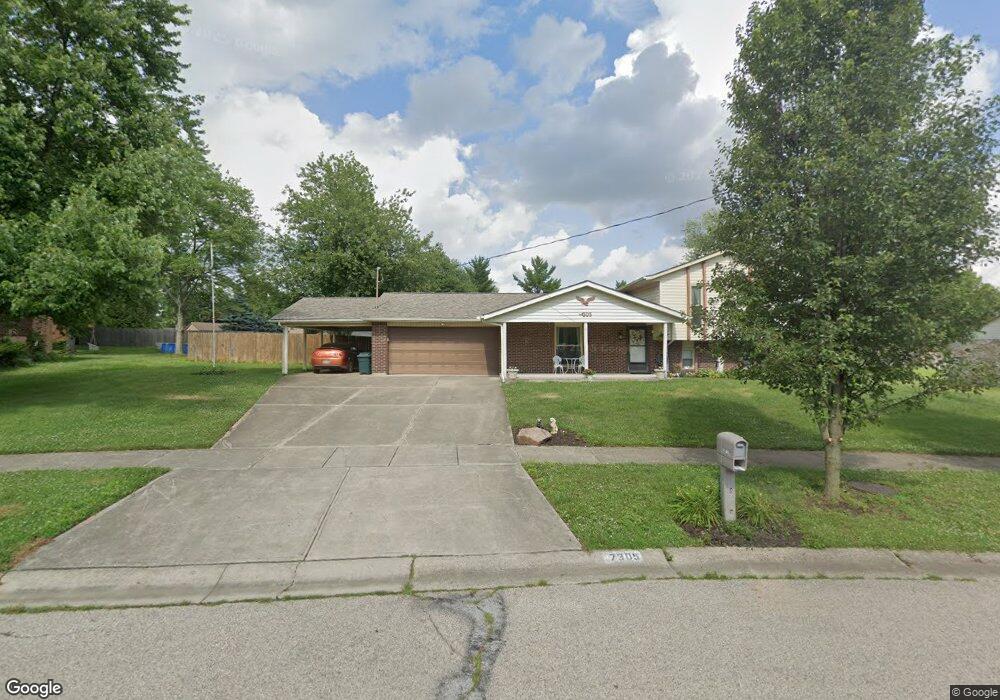
7305 Red Coat Dr Hamilton, OH 45011
Estimated Value: $239,000 - $322,000
3
Beds
3
Baths
1,120
Sq Ft
$251/Sq Ft
Est. Value
About This Home
This home is located at 7305 Red Coat Dr, Hamilton, OH 45011 and is currently estimated at $281,559, approximately $251 per square foot. 7305 Red Coat Dr is a home located in Butler County with nearby schools including Fairfield East Elementary School, Creekside Middle School, and Fairfield Senior High School.
Ownership History
Date
Name
Owned For
Owner Type
Purchase Details
Closed on
May 7, 2013
Sold by
Teeple John R and Teeple Linda J
Bought by
Teeple Jason M
Current Estimated Value
Home Financials for this Owner
Home Financials are based on the most recent Mortgage that was taken out on this home.
Original Mortgage
$86,500
Outstanding Balance
$17,065
Interest Rate
3.39%
Mortgage Type
New Conventional
Estimated Equity
$264,494
Purchase Details
Closed on
Dec 7, 2012
Sold by
Gray Pauletta and Gray William B
Bought by
Teeple John R and Teeple Linda J
Purchase Details
Closed on
Jun 23, 2005
Sold by
Downie David M and Downie Tara L
Bought by
Gray William B and Gray Pauletta
Home Financials for this Owner
Home Financials are based on the most recent Mortgage that was taken out on this home.
Original Mortgage
$142,100
Interest Rate
5.86%
Mortgage Type
FHA
Purchase Details
Closed on
May 1, 1986
Purchase Details
Closed on
Oct 1, 1985
Create a Home Valuation Report for This Property
The Home Valuation Report is an in-depth analysis detailing your home's value as well as a comparison with similar homes in the area
Home Values in the Area
Average Home Value in this Area
Purchase History
| Date | Buyer | Sale Price | Title Company |
|---|---|---|---|
| Teeple Jason M | $86,500 | None Available | |
| Teeple John R | $84,000 | None Available | |
| Gray William B | $155,000 | -- | |
| -- | $75,000 | -- | |
| -- | $66,000 | -- |
Source: Public Records
Mortgage History
| Date | Status | Borrower | Loan Amount |
|---|---|---|---|
| Open | Teeple Jason M | $86,500 | |
| Previous Owner | Gray William B | $142,100 |
Source: Public Records
Tax History
| Year | Tax Paid | Tax Assessment Tax Assessment Total Assessment is a certain percentage of the fair market value that is determined by local assessors to be the total taxable value of land and additions on the property. | Land | Improvement |
|---|---|---|---|---|
| 2025 | $3,108 | $82,970 | $13,040 | $69,930 |
| 2024 | $3,108 | $82,970 | $13,040 | $69,930 |
| 2023 | $3,081 | $94,250 | $13,040 | $81,210 |
| 2022 | $3,202 | $63,240 | $13,040 | $50,200 |
| 2021 | $2,869 | $60,400 | $13,040 | $47,360 |
| 2020 | $2,969 | $60,400 | $13,040 | $47,360 |
| 2019 | $4,681 | $49,800 | $11,990 | $37,810 |
| 2018 | $2,790 | $49,800 | $11,990 | $37,810 |
| 2017 | $2,817 | $49,800 | $11,990 | $37,810 |
| 2016 | $2,839 | $47,590 | $11,990 | $35,600 |
| 2015 | $2,800 | $47,590 | $11,990 | $35,600 |
| 2014 | $2,573 | $47,640 | $11,990 | $35,650 |
| 2013 | $2,573 | $46,980 | $11,990 | $34,990 |
Source: Public Records
Map
Nearby Homes
- 7249 Woodberry Dr
- 7225 Woodberry Dr
- 7142 Woodberry Dr
- 3798 Riverdowns Ct
- 7893 Jessies Way
- 7885 Jessies Way
- 3760 Stockbridge Ln
- 7918 Jessies Way Unit 304
- 7918 Jessies Way
- 3835 Schroeder Dr
- 6653 Clovis Dr
- 2921 Tylersville Rd
- 895 Millers Run Ct
- 5518 Pacific Crest Ln
- 3690 Buttonwood Ct
- 4058 Schroeder Dr
- 0 Princeton Unit 1867105
- 4224 College Dictionary
- 4257 Primary Colors
- 4401 E Observatory
- 7297 Red Coat Dr
- 7313 Red Coat Dr
- 3457 Cobblestone Way
- 7291 Saratoga Ct
- 7321 Red Coat Dr
- 7296 Red Coat Dr
- 7131 Iron Kettle Dr
- 7284 Saratoga Ct
- 7306 Red Coat Dr
- 7301 Saratoga Ct
- 7119 Iron Kettle Dr
- 7286 Red Coat Dr
- 3444 Cobblestone Way
- 7316 Red Coat Dr
- 7329 Red Coat Dr
- 3454 Cobblestone Way
- 7109 Iron Kettle Dr
- 7311 Saratoga Ct
- 7145 Iron Kettle Dr
- 7270 Red Coat Dr
Your Personal Tour Guide
Ask me questions while you tour the home.