Estimated Value: $634,425 - $716,000
4
Beds
3
Baths
4,307
Sq Ft
$156/Sq Ft
Est. Value
About This Home
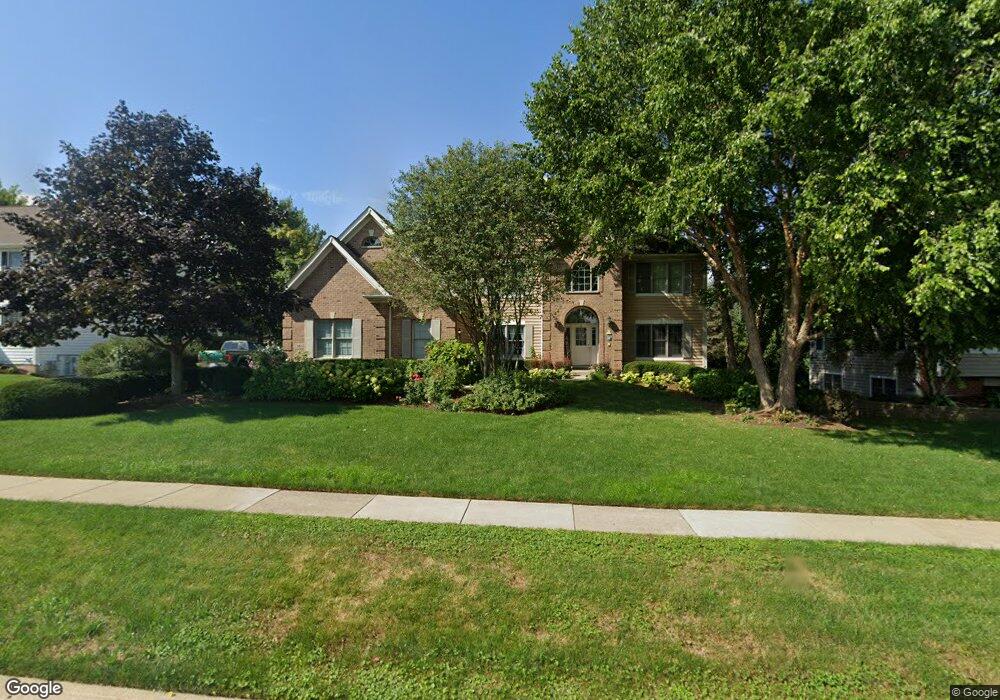
This home is located at 7305 Swan Way, Cary, IL 60013 and is currently estimated at $673,475, approximately $156 per square foot. 7305 Swan Way is a home located in McHenry County with nearby schools including Three Oaks Elementary School, Cary Jr High School, and Cary Grove High School.
Ownership History
Date
Name
Owned For
Owner Type
Purchase Details
Closed on
Sep 24, 2008
Sold by
Pauli Dennis and Pauli Jori
Bought by
Barnes Larry W and Barnes Joann L
Current Estimated Value
Home Financials for this Owner
Home Financials are based on the most recent Mortgage that was taken out on this home.
Original Mortgage
$417,000
Outstanding Balance
$279,152
Interest Rate
6.57%
Mortgage Type
Purchase Money Mortgage
Estimated Equity
$394,323
Purchase Details
Closed on
Oct 2, 2002
Sold by
Holland Builders Inc
Bought by
Pauli Dennis and Pauli Jori
Home Financials for this Owner
Home Financials are based on the most recent Mortgage that was taken out on this home.
Original Mortgage
$378,800
Interest Rate
5.25%
Purchase Details
Closed on
Oct 26, 2001
Sold by
Harris Trust & Svgs Bank
Bought by
Holland Builders Inc
Create a Home Valuation Report for This Property
The Home Valuation Report is an in-depth analysis detailing your home's value as well as a comparison with similar homes in the area
Home Values in the Area
Average Home Value in this Area
Purchase History
| Date | Buyer | Sale Price | Title Company |
|---|---|---|---|
| Barnes Larry W | $600,000 | Chicago Title Insurance Co | |
| Pauli Dennis | $473,545 | -- | |
| Holland Builders Inc | $67,000 | -- |
Source: Public Records
Mortgage History
| Date | Status | Borrower | Loan Amount |
|---|---|---|---|
| Open | Barnes Larry W | $417,000 | |
| Previous Owner | Pauli Dennis | $378,800 |
Source: Public Records
Tax History Compared to Growth
Tax History
| Year | Tax Paid | Tax Assessment Tax Assessment Total Assessment is a certain percentage of the fair market value that is determined by local assessors to be the total taxable value of land and additions on the property. | Land | Improvement |
|---|---|---|---|---|
| 2024 | $13,539 | $177,363 | $26,108 | $151,255 |
| 2023 | $13,253 | $158,629 | $23,350 | $135,279 |
| 2022 | $13,619 | $158,876 | $39,089 | $119,787 |
| 2021 | $13,002 | $148,012 | $36,416 | $111,596 |
| 2020 | $12,626 | $142,772 | $35,127 | $107,645 |
| 2019 | $12,384 | $136,650 | $33,621 | $103,029 |
| 2018 | $14,734 | $157,634 | $31,059 | $126,575 |
| 2017 | $14,475 | $148,502 | $29,260 | $119,242 |
| 2016 | $14,401 | $139,281 | $27,443 | $111,838 |
| 2013 | -- | $135,942 | $25,600 | $110,342 |
Source: Public Records
Map
Nearby Homes
- 1712 Squirrel Trail
- 0 Three Oaks Dr Unit MRD12417647
- 406 Catkins Way
- 1055 White Pine Dr
- LOT 02 Three Oaks Rd
- 380 Merion Dr
- 312 Wooded Knoll Dr
- 50 Erin Dr
- 515 Crest Dr
- 296 Foxford Dr Unit 1
- 365 Oakmont Dr
- 331 Parkstone Dr
- 322 Parkstone Dr
- 305 Bell Dr
- 305 Pearl St
- 336 W Margaret Terrace
- 26 Wagner Dr
- 340 W Margaret Terrace
- 326 Alicia Dr
- 324 Alma Terrace