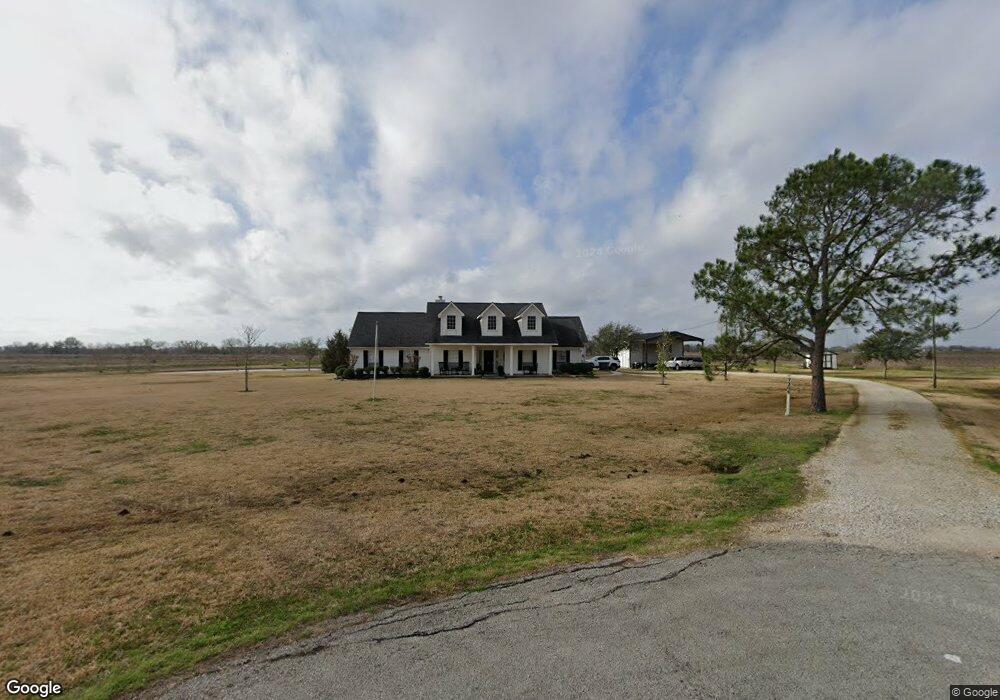
7306 Anderson Cir Richmond, TX 77469
Estimated Value: $363,000 - $656,000
4
Beds
3
Baths
2,319
Sq Ft
$201/Sq Ft
Est. Value
About This Home
This home is located at 7306 Anderson Cir, Richmond, TX 77469 and is currently estimated at $466,824, approximately $201 per square foot. 7306 Anderson Cir is a home located in Fort Bend County with nearby schools including Needville Elementary School, Needville Junior High School, and Needville Middle School.
Ownership History
Date
Name
Owned For
Owner Type
Purchase Details
Closed on
Jul 28, 2006
Sold by
Risinger Rocky and Risinger Charlotte
Bought by
Prihoda Kenneth W and Prihoda Dianna
Current Estimated Value
Home Financials for this Owner
Home Financials are based on the most recent Mortgage that was taken out on this home.
Original Mortgage
$187,200
Outstanding Balance
$111,535
Interest Rate
6.62%
Mortgage Type
New Conventional
Estimated Equity
$355,289
Purchase Details
Closed on
Dec 4, 1998
Sold by
Friedman E G
Bought by
Risinger Rocky and Risinger Charlotte
Home Financials for this Owner
Home Financials are based on the most recent Mortgage that was taken out on this home.
Original Mortgage
$12,800
Interest Rate
6.81%
Mortgage Type
Seller Take Back
Create a Home Valuation Report for This Property
The Home Valuation Report is an in-depth analysis detailing your home's value as well as a comparison with similar homes in the area
Home Values in the Area
Average Home Value in this Area
Purchase History
| Date | Buyer | Sale Price | Title Company |
|---|---|---|---|
| Prihoda Kenneth W | -- | Universal Land Title | |
| Risinger Rocky | -- | Fidelity National Title |
Source: Public Records
Mortgage History
| Date | Status | Borrower | Loan Amount |
|---|---|---|---|
| Open | Prihoda Kenneth W | $187,200 | |
| Previous Owner | Risinger Rocky | $12,800 |
Source: Public Records
Tax History Compared to Growth
Tax History
| Year | Tax Paid | Tax Assessment Tax Assessment Total Assessment is a certain percentage of the fair market value that is determined by local assessors to be the total taxable value of land and additions on the property. | Land | Improvement |
|---|---|---|---|---|
| 2025 | $4,960 | $378,922 | $109,129 | $269,793 |
| 2024 | $4,960 | $367,243 | $109,129 | $258,114 |
| 2023 | $6,021 | $413,473 | $109,129 | $304,344 |
| 2022 | $6,386 | $387,040 | $59,600 | $327,440 |
| 2021 | $6,670 | $351,850 | $92,390 | $259,460 |
| 2020 | $7,197 | $356,010 | $83,110 | $272,900 |
| 2019 | $7,325 | $341,180 | $83,110 | $258,070 |
| 2018 | $7,553 | $352,180 | $67,640 | $284,540 |
| 2017 | $7,206 | $334,990 | $67,640 | $267,350 |
| 2016 | $6,551 | $304,540 | $45,090 | $259,450 |
| 2015 | $5,703 | $291,400 | $46,230 | $245,170 |
| 2014 | $5,382 | $264,910 | $38,190 | $226,720 |
Source: Public Records
Map
Nearby Homes
- Pinehollow Plan at Esperanza - Cottage Collection
- Oakridge Plan at Esperanza - Cottage Collection
- Willow II Plan at Esperanza - Avante Collection
- Everett II Plan at Esperanza - Avante Collection
- Cupertino II Plan at Esperanza - Avante Collection
- Haven II Plan at Esperanza - Avante Collection
- Whitetail Plan at Esperanza - Avante Collection
- Kitson Plan at Esperanza - Cottage Collection
- Addison Plan at Esperanza - Cottage Collection
- Idlewood Plan at Esperanza - Cottage Collection
- Linfield Plan at Esperanza - Avante Collection
- 4955 Dr
- 4939 Esperanza Terrace Dr
- 4821 Walters Rd
- 8022 Oberrender Rd
- 7403 Fm 361 Rd
- 0 Fm 361 Rd Unit 24089668
- 5103 Santa Cruz Bay
- 5115 Santa Cruz Bay
- 5123 Santa Cruz Bay Bayou
- 7302 Anderson Cir
- 7303 Anderson Cir
- 7307 Anderson Cir
- 0 Anderson Cir
- 5314 Daniels
- 5314 Daniels
- 7211 Anderson Cir
- 0 Daniels Ln Unit 65015649
- 5307 Daniels Ln
- 7207 Anderson Cir
- 7210 Kelly Ln
- 5310 Daniels Ln
- 5211 Walters Rd
- 5306 Daniels Ln
- 7211 Kelly Ln
- 7202 Anderson Cir
- 7211 Kelly Ln Tract 26
- 5210 Walters Rd
- 5202 Walters Rd
- 0 Kelly Ln