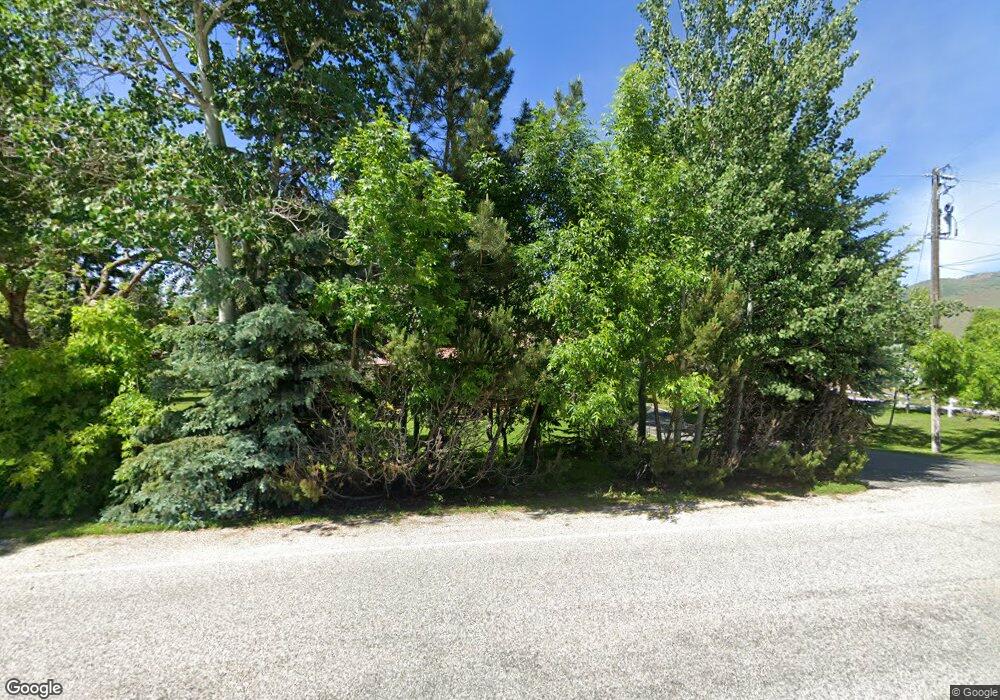
7306 E 100 S Huntsville, UT 84317
Estimated Value: $668,000 - $1,199,000
3
Beds
1
Bath
1,851
Sq Ft
$501/Sq Ft
Est. Value
About This Home
This home is located at 7306 E 100 S, Huntsville, UT 84317 and is currently estimated at $927,345, approximately $500 per square foot. 7306 E 100 S is a home with nearby schools including Valley Elementary School, Snowcrest Junior High School, and Weber High School.
Ownership History
Date
Name
Owned For
Owner Type
Purchase Details
Closed on
Jan 3, 2013
Sold by
Goodin Ronald D and Goodin Erin M
Bought by
Wayman Steven
Current Estimated Value
Home Financials for this Owner
Home Financials are based on the most recent Mortgage that was taken out on this home.
Original Mortgage
$291,000
Outstanding Balance
$201,384
Interest Rate
3.27%
Mortgage Type
New Conventional
Estimated Equity
$725,961
Purchase Details
Closed on
Feb 27, 2003
Sold by
Goodin Ronald D
Bought by
Goodin Ronald D
Home Financials for this Owner
Home Financials are based on the most recent Mortgage that was taken out on this home.
Original Mortgage
$85,625
Interest Rate
5.93%
Mortgage Type
Purchase Money Mortgage
Purchase Details
Closed on
Feb 20, 1998
Sold by
Goodin Ronald Douglas
Bought by
Goodin Ronald D
Home Financials for this Owner
Home Financials are based on the most recent Mortgage that was taken out on this home.
Original Mortgage
$90,000
Interest Rate
6.9%
Create a Home Valuation Report for This Property
The Home Valuation Report is an in-depth analysis detailing your home's value as well as a comparison with similar homes in the area
Home Values in the Area
Average Home Value in this Area
Purchase History
| Date | Buyer | Sale Price | Title Company |
|---|---|---|---|
| Wayman Steven | -- | Aspen Title | |
| Goodin Ronald D | -- | First American Title | |
| Goodin Ronald D | -- | -- |
Source: Public Records
Mortgage History
| Date | Status | Borrower | Loan Amount |
|---|---|---|---|
| Open | Wayman Steven | $291,000 | |
| Previous Owner | Goodin Ronald D | $85,625 | |
| Previous Owner | Goodin Ronald D | $90,000 |
Source: Public Records
Tax History Compared to Growth
Tax History
| Year | Tax Paid | Tax Assessment Tax Assessment Total Assessment is a certain percentage of the fair market value that is determined by local assessors to be the total taxable value of land and additions on the property. | Land | Improvement |
|---|---|---|---|---|
| 2025 | $4,545 | $820,091 | $433,511 | $386,580 |
| 2024 | $4,365 | $801,998 | $447,337 | $354,661 |
| 2023 | $4,176 | $753,999 | $378,472 | $375,527 |
| 2022 | $4,453 | $820,999 | $338,818 | $482,181 |
| 2021 | $3,112 | $522,803 | $229,180 | $293,623 |
| 2020 | $2,845 | $433,999 | $129,448 | $304,551 |
| 2019 | $2,953 | $425,001 | $109,625 | $315,376 |
| 2018 | $3,061 | $422,801 | $109,625 | $313,176 |
| 2017 | $2,685 | $359,535 | $94,637 | $264,898 |
| 2016 | $2,620 | $193,382 | $49,304 | $144,078 |
| 2015 | $2,666 | $193,366 | $46,548 | $146,818 |
| 2014 | $2,655 | $187,943 | $46,548 | $141,395 |
Source: Public Records
Map
Nearby Homes
- 439 S 7900 E Unit 11
- 439 S 7900 E
- 260 S 7900 E
- 260 S 7900 E Unit 3
- 4400 Plan at SAGE
- 3500 Plan at SAGE
- 4200 Plan at SAGE
- 387 S 7900 E
- 441 S 7900 E
- 7768 E 1075 N
- 7345 E 900 S
- 6486 E Highway 39 Unit 47
- 6486 E Highway 39 Unit 64
- 6486 E Highway 39 Unit 32
- 6486 E Highway 39 Unit 24
- 335 S 7900 E Unit 15
- 249 S 7900 E Unit 18
- 423 S 7900 E Unit 12
- 484 S 7900 E Unit 9
- 357 S 7900 E Unit 14