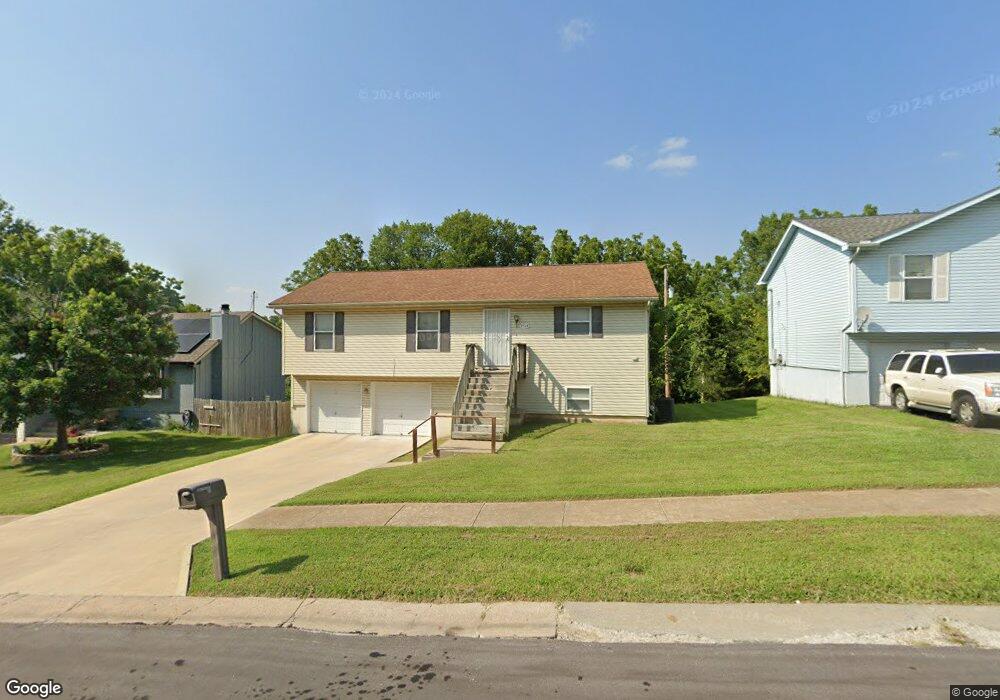
7306 E 122nd St Grandview, MO 64030
Estimated Value: $259,000 - $275,000
3
Beds
3
Baths
1,286
Sq Ft
$209/Sq Ft
Est. Value
About This Home
This home is located at 7306 E 122nd St, Grandview, MO 64030 and is currently estimated at $268,984, approximately $209 per square foot. 7306 E 122nd St is a home located in Jackson County with nearby schools including Ingels Elementary School, Ruskin High School, and Life-a-New Preparatory Academy.
Ownership History
Date
Name
Owned For
Owner Type
Purchase Details
Closed on
Mar 22, 2017
Sold by
Chief Pony & Houses Llc
Bought by
Ovation Rentals Llc
Current Estimated Value
Purchase Details
Closed on
Jan 20, 2017
Sold by
Dulaney Della Joan and Dulaney Everett W
Bought by
Chief Pony & Houses Llc
Purchase Details
Closed on
Jul 20, 2005
Sold by
Dulaney Everett W and Dulaney Della J
Bought by
Dulaney Della Joan and Dulaney Everett W
Purchase Details
Closed on
Mar 19, 2003
Sold by
Dulaney Construction Co
Bought by
Aj Homes Llc
Home Financials for this Owner
Home Financials are based on the most recent Mortgage that was taken out on this home.
Original Mortgage
$1,500,000
Interest Rate
5.83%
Purchase Details
Closed on
Jan 8, 2003
Sold by
Robertson Properties Inc
Bought by
Dulaney Construction Co
Create a Home Valuation Report for This Property
The Home Valuation Report is an in-depth analysis detailing your home's value as well as a comparison with similar homes in the area
Home Values in the Area
Average Home Value in this Area
Purchase History
| Date | Buyer | Sale Price | Title Company |
|---|---|---|---|
| Ovation Rentals Llc | $85,000 | None Available | |
| Chief Pony & Houses Llc | -- | Brokers Title Llc | |
| Dulaney Della Joan | -- | First American Title Ins Co | |
| Aj Homes Llc | -- | Ati Title Company | |
| Dulaney Construction Co | -- | Multiple |
Source: Public Records
Mortgage History
| Date | Status | Borrower | Loan Amount |
|---|---|---|---|
| Previous Owner | Aj Homes Llc | $1,500,000 |
Source: Public Records
Tax History
| Year | Tax Paid | Tax Assessment Tax Assessment Total Assessment is a certain percentage of the fair market value that is determined by local assessors to be the total taxable value of land and additions on the property. | Land | Improvement |
|---|---|---|---|---|
| 2025 | $3,838 | $40,956 | $4,197 | $36,759 |
| 2024 | $3,772 | $46,235 | $4,699 | $41,536 |
| 2023 | $3,772 | $46,235 | $5,892 | $40,343 |
| 2022 | $2,941 | $30,970 | $3,563 | $27,407 |
| 2021 | $2,518 | $30,970 | $3,563 | $27,407 |
| 2020 | $2,428 | $28,125 | $3,563 | $24,562 |
| 2019 | $2,319 | $28,125 | $3,563 | $24,562 |
| 2018 | $1,721 | $19,103 | $2,421 | $16,682 |
| 2016 | $1,736 | $18,624 | $2,204 | $16,420 |
Source: Public Records
Map
Nearby Homes
- 7310 E 122nd Terrace
- 11946 Smalley Ave
- 7918 Southview Dr
- 8012 Sunset Cir
- 11725 Crystal Dr
- 7509 E 127 St
- 7915 E 117 Terrace
- 7917 E 117th St
- 7408 E 117th Place
- 12525 Craig Ave
- 11604 Manchester Ave
- 12801 Corrington Ave
- 12800 Crystal Ave
- 11605 Richmond Ave
- 11804 Fuller Ave
- 11715 Fuller Ave
- 7205 Longview Rd
- 12011 Belmont Ave
- 12825 Winchester Ave
- 11718 Fremont Ave
- 7308 E 122nd St
- 7304 E 122nd St
- 7310 E 122nd St
- 7302 E 122nd St
- 7305 E 122nd St
- 7309 E 122nd St
- 7311 E 122nd St
- 7312 E 122nd St
- 12101 Food Ln
- 7301 E 122nd St
- 7313 E 122nd St
- 7314 E 122nd St
- 7306 E 122nd Terrace
- 7308 E 122 Terrace
- 7308 E 122nd Terrace
- Lot 8 122nd St
- Lot 7 122nd St
- Lot 6 122nd St
- 6712 & 6800 E 122nd St
- 7304 E 122nd Terrace
Your Personal Tour Guide
Ask me questions while you tour the home.