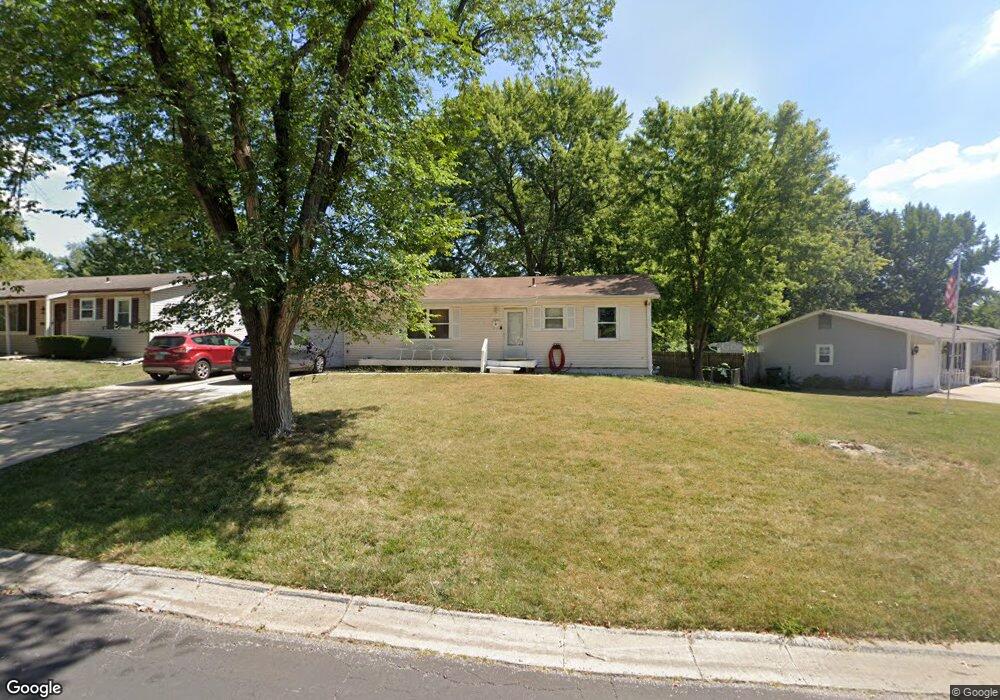
7307 Appleton Ave Raytown, MO 64133
Estimated Value: $195,000 - $206,000
3
Beds
1
Bath
912
Sq Ft
$220/Sq Ft
Est. Value
About This Home
This home is located at 7307 Appleton Ave, Raytown, MO 64133 and is currently estimated at $200,449, approximately $219 per square foot. 7307 Appleton Ave is a home located in Jackson County with nearby schools including Robinson Elementary School, Raytown Central Middle School, and Carver Christian Academy.
Ownership History
Date
Name
Owned For
Owner Type
Purchase Details
Closed on
Mar 23, 2007
Sold by
Robinson Frances M and Robinson Charles W
Bought by
Robinson Charles W and Robinson Francis M
Current Estimated Value
Home Financials for this Owner
Home Financials are based on the most recent Mortgage that was taken out on this home.
Original Mortgage
$96,050
Outstanding Balance
$58,265
Interest Rate
6.3%
Mortgage Type
Stand Alone Refi Refinance Of Original Loan
Estimated Equity
$142,184
Purchase Details
Closed on
Jun 16, 1999
Bought by
Robinson Charles W
Home Financials for this Owner
Home Financials are based on the most recent Mortgage that was taken out on this home.
Original Mortgage
$72,963
Interest Rate
7.02%
Mortgage Type
FHA
Purchase Details
Closed on
May 28, 1998
Sold by
Larson Michael H and Larson Elizabeth A
Bought by
M & I Mtg Corp
Purchase Details
Closed on
Apr 27, 1998
Sold by
M & I Mtg Corp
Bought by
Hud
Create a Home Valuation Report for This Property
The Home Valuation Report is an in-depth analysis detailing your home's value as well as a comparison with similar homes in the area
Home Values in the Area
Average Home Value in this Area
Purchase History
| Date | Buyer | Sale Price | Title Company |
|---|---|---|---|
| Robinson Charles W | -- | Coffelt Land Title Inc | |
| Robinson Charles W | -- | -- | |
| M & I Mtg Corp | $54,301 | Old Republic Title | |
| Hud | -- | -- |
Source: Public Records
Mortgage History
| Date | Status | Borrower | Loan Amount |
|---|---|---|---|
| Open | Robinson Charles W | $96,050 | |
| Closed | Robinson Charles W | $72,963 |
Source: Public Records
Tax History
| Year | Tax Paid | Tax Assessment Tax Assessment Total Assessment is a certain percentage of the fair market value that is determined by local assessors to be the total taxable value of land and additions on the property. | Land | Improvement |
|---|---|---|---|---|
| 2025 | $2,750 | $21,609 | $5,052 | $16,557 |
| 2024 | $2,750 | $30,486 | $3,699 | $26,787 |
| 2023 | $2,732 | $30,486 | $2,706 | $27,780 |
| 2022 | $1,537 | $16,340 | $4,076 | $12,264 |
| 2021 | $1,542 | $16,340 | $4,076 | $12,264 |
| 2020 | $1,563 | $16,399 | $4,076 | $12,323 |
| 2019 | $1,554 | $16,399 | $4,076 | $12,323 |
| 2018 | $1,448 | $15,818 | $3,393 | $12,425 |
| 2017 | $1,448 | $15,818 | $3,393 | $12,425 |
| 2016 | $1,403 | $15,421 | $3,131 | $12,290 |
| 2014 | $1,378 | $14,972 | $3,040 | $11,932 |
Source: Public Records
Map
Nearby Homes
- 10604 E 75th St
- 7308 Crisp Ave
- 7520 Lewis Ave
- 7141 Sterling Ave
- 7420 Hardy Ave
- 7101 Willow Ave
- 7427 & 7429 Englewood Ln
- 7423 & 7425 Englewood Ln
- 10208 E 71st Terrace
- 7007 Lakeshore Dr
- 7308 Cedar Ave
- 7606 Woodson Rd
- 7005 Raytown Rd
- 10601 E 78th Terrace
- 6828 Vermont Ave
- 10005 E 69th Terrace
- 11800 E 77th St
- 6817 Englewood Ave
- 6817 Lakeshore Dr
- 11605 E 78th St
- 7311 Appleton Ave
- 7303 Appleton Ave
- 7304 Harris Ave
- 7315 Appleton Ave
- 7308 Harris Ave
- 7304 Appleton Ave
- 7300 Appleton Ave
- 7308 Appleton Ave
- 7312 Appleton Ave
- 7306 Appleton Ave
- 7319 Appleton Ave
- 7312 Harris Ave
- 7301 Harris Ave
- 7316 Appleton Ave
- 7305 Harris Ave
- 7316 Harris Ave
- 7309 Harris Ave
- 7229 Harris Ave
- 7228 Harris Ave
- 7320 Appleton Ave
Your Personal Tour Guide
Ask me questions while you tour the home.