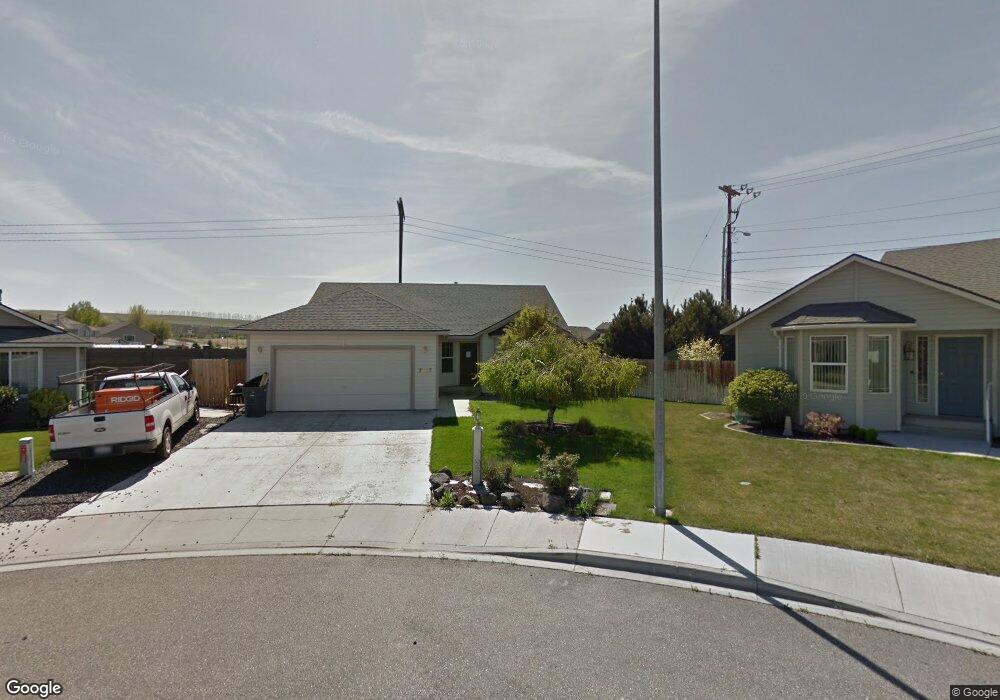
7307 W 6th Place Kennewick, WA 99336
Estimated Value: $397,000 - $448,000
3
Beds
2
Baths
1,451
Sq Ft
$286/Sq Ft
Est. Value
About This Home
This home is located at 7307 W 6th Place, Kennewick, WA 99336 and is currently estimated at $415,539, approximately $286 per square foot. 7307 W 6th Place is a home located in Benton County with nearby schools including Ridge View Elementary School, Kamiakin High School, and SKYLAR EDUCATION ACADEMY.
Ownership History
Date
Name
Owned For
Owner Type
Purchase Details
Closed on
Sep 26, 2008
Sold by
Grigsby Deborah
Bought by
Grigsby Jack
Current Estimated Value
Purchase Details
Closed on
Jul 15, 2008
Sold by
Helland Kristy M
Bought by
The Bank Of New York
Purchase Details
Closed on
Dec 14, 2006
Sold by
Helland Devin L
Bought by
Helland Kristy M
Home Financials for this Owner
Home Financials are based on the most recent Mortgage that was taken out on this home.
Original Mortgage
$138,600
Interest Rate
7.87%
Mortgage Type
Purchase Money Mortgage
Purchase Details
Closed on
Aug 28, 2006
Sold by
Longmire Donald R
Bought by
Les Bunch & Robert A Johnson Inc
Create a Home Valuation Report for This Property
The Home Valuation Report is an in-depth analysis detailing your home's value as well as a comparison with similar homes in the area
Home Values in the Area
Average Home Value in this Area
Purchase History
| Date | Buyer | Sale Price | Title Company |
|---|---|---|---|
| Grigsby Jack | -- | Frontier Title & Escrow Co | |
| Grigsby Jack | -- | Frontier Title & Escrow Co | |
| Grigsby Jack | $141,900 | Frontier Title & Escrow Co | |
| The Bank Of New York | $134,910 | Chicago Title | |
| Helland Kristy M | -- | Cascade Title | |
| Helland Kristy M | $154,000 | Cascade Title | |
| Les Bunch & Robert A Johnson Inc | $117,301 | None Available |
Source: Public Records
Mortgage History
| Date | Status | Borrower | Loan Amount |
|---|---|---|---|
| Previous Owner | Helland Kristy M | $138,600 |
Source: Public Records
Tax History Compared to Growth
Tax History
| Year | Tax Paid | Tax Assessment Tax Assessment Total Assessment is a certain percentage of the fair market value that is determined by local assessors to be the total taxable value of land and additions on the property. | Land | Improvement |
|---|---|---|---|---|
| 2024 | $2,784 | $375,250 | $70,000 | $305,250 |
| 2023 | $2,784 | $347,500 | $70,000 | $277,500 |
| 2022 | $2,498 | $273,500 | $70,000 | $203,500 |
| 2021 | $2,293 | $255,000 | $70,000 | $185,000 |
| 2020 | $2,265 | $226,780 | $40,000 | $186,780 |
| 2019 | $1,960 | $214,330 | $40,000 | $174,330 |
| 2018 | $2,080 | $189,420 | $40,000 | $149,420 |
| 2017 | $1,904 | $164,520 | $40,000 | $124,520 |
| 2016 | $1,936 | $164,520 | $40,000 | $124,520 |
| 2015 | $1,840 | $164,520 | $40,000 | $124,520 |
| 2014 | -- | $155,190 | $34,000 | $121,190 |
| 2013 | -- | $155,190 | $34,000 | $121,190 |
Source: Public Records
Map
Nearby Homes
- 634 S Young St
- 7306 W 7th Ave
- 508 S Wilson St
- 311 S Columbia Center Blvd
- 312 S Columbia Center Blvd Unit 95
- 312 S Columbia Center Blvd Unit 45
- 312 S Columbia Center Blvd Unit 93
- 312 S Columbia Center Blvd Unit 85
- 312 S Columbia Center Blvd Unit 23
- 312 S Columbia Center Blvd Unit 71
- 312 S Columbia Center Blvd Unit 86
- 312 S Columbia Center Blvd Unit 89
- 312 S Columbia Center Blvd Unit 74
- 312 S Columbia Center Blvd Unit 96
- 312 S Columbia Center Blvd Unit 63
- 312 S Columbia Center Blvd Unit 28
- 312 S Columbia Center Blvd Unit 51
- 312 S Columbia Center Blvd Unit 62
- 312 S Columbia Center Blvd Unit 34
- 404 S Georgia St
- 7301 W 6th Place
- 520 S Belfair St Unit Quality Home, Downsi
- 520 S Belfair St Unit Motivated Seller, AD
- 520 S Belfair St Unit New Price Motivated
- 520 S Belfair St
- 514 S Belfair St
- 7219 W 6th Place
- 509 S Delaware St
- 7224 W 6th Place
- 508 S Belfair St
- 501 S Delaware St
- 505 S Delaware St
- 7218 W 6th Place
- 7213 W 6th Place
- 511 S Delaware St
- 7227 W 5th Place
- 606 S Young St Unit Fantastic .71 Acre L
- 606 S Young St Unit One of a Kind - .71
- 606 S Young St
- 502 S Belfair St