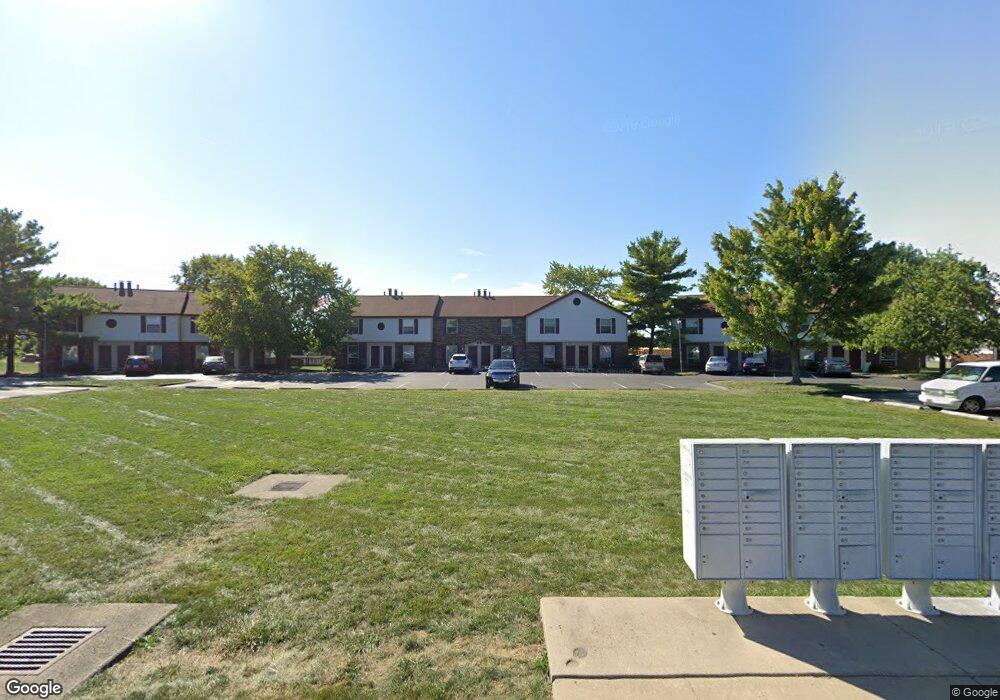
7309 Cimmaron Station Unit 7303 Columbus, OH 43235
Brookside Colony NeighborhoodEstimated Value: $198,911 - $220,000
2
Beds
2
Baths
1,024
Sq Ft
$203/Sq Ft
Est. Value
About This Home
This home is located at 7309 Cimmaron Station Unit 7303, Columbus, OH 43235 and is currently estimated at $208,228, approximately $203 per square foot. 7309 Cimmaron Station Unit 7303 is a home located in Franklin County with nearby schools including Indian Run Elementary School, Ann Simpson Davis Middle School, and Dublin Scioto High School.
Ownership History
Date
Name
Owned For
Owner Type
Purchase Details
Closed on
Mar 5, 2007
Sold by
Tibbetts Robert M
Bought by
Lm Properties Of Ohio Ltd
Current Estimated Value
Home Financials for this Owner
Home Financials are based on the most recent Mortgage that was taken out on this home.
Original Mortgage
$510,000
Interest Rate
6.28%
Mortgage Type
Purchase Money Mortgage
Purchase Details
Closed on
Feb 26, 2003
Sold by
Bash Herbert W and Bash Theresa L
Bought by
Tibbetts Robert M
Home Financials for this Owner
Home Financials are based on the most recent Mortgage that was taken out on this home.
Original Mortgage
$302,000
Interest Rate
6%
Mortgage Type
Purchase Money Mortgage
Purchase Details
Closed on
Jan 6, 1994
Purchase Details
Closed on
Apr 1, 1985
Create a Home Valuation Report for This Property
The Home Valuation Report is an in-depth analysis detailing your home's value as well as a comparison with similar homes in the area
Home Values in the Area
Average Home Value in this Area
Purchase History
| Date | Buyer | Sale Price | Title Company |
|---|---|---|---|
| Lm Properties Of Ohio Ltd | $318,800 | Attorney | |
| Tibbetts Robert M | $377,500 | Amerititle Mill Run | |
| -- | $268,500 | -- | |
| -- | -- | -- |
Source: Public Records
Mortgage History
| Date | Status | Borrower | Loan Amount |
|---|---|---|---|
| Closed | Lm Properties Of Ohio Ltd | $510,000 | |
| Previous Owner | Tibbetts Robert M | $302,000 |
Source: Public Records
Tax History Compared to Growth
Tax History
| Year | Tax Paid | Tax Assessment Tax Assessment Total Assessment is a certain percentage of the fair market value that is determined by local assessors to be the total taxable value of land and additions on the property. | Land | Improvement |
|---|---|---|---|---|
| 2024 | $2,781 | $45,050 | $5,250 | $39,800 |
| 2023 | $2,743 | $45,045 | $5,250 | $39,795 |
| 2022 | $1,272 | $19,360 | $2,800 | $16,560 |
| 2021 | $1,293 | $19,360 | $2,800 | $16,560 |
| 2020 | $1,285 | $19,360 | $2,800 | $16,560 |
| 2019 | $1,452 | $19,360 | $2,800 | $16,560 |
| 2018 | $1,303 | $19,360 | $2,800 | $16,560 |
| 2017 | $1,346 | $19,360 | $2,800 | $16,560 |
| 2016 | $1,141 | $15,410 | $3,470 | $11,940 |
| 2015 | $1,147 | $15,410 | $3,470 | $11,940 |
| 2014 | $1,149 | $15,410 | $3,470 | $11,940 |
| 2013 | $583 | $15,400 | $3,465 | $11,935 |
Source: Public Records
Map
Nearby Homes
- 7385 Cimmaron Station
- 2548 Timberside Dr Unit 2548
- 2546 Timberside Dr Unit 2546
- 2533 Timberside Dr
- 7373 Palmleaf Ln
- 3915 Inverness Cir Unit 3915
- 2392 Dunsworth Dr
- 2161 Heatherfield Ave
- 4171 Tuller Rd Unit Lot 1101
- 4175 Tuller Rd Unit Lot 1102
- 4179 Tuller Rd Unit Lot 1103
- 4183 Tuller Rd Unit Lot 1104
- 4156 Mccune Ave Unit Lot 1404
- 2456 Sanford Dr
- 4164 Mccune Ave Unit Lot 1402
- 4168 Mccune Ave Unit Lot 1401
- 4191 Tuller Rd Unit Lot 1106
- 7871 Thornfield Ln
- 4231 Troutbrook Dr
- 2469 Sandstrom Dr
- 7311 Cimmaron Station Unit 7303
- 7307 Cimmaron Station Unit 7303
- 7305 Cimmaron Station Unit 7303
- 7313 Cimmaron Station Unit 7303
- 7303 Cimmaron Station Unit 7303
- 7317 Cimmaron Station Unit 7399
- 7299 Cimmaron Station
- 7319 Cimmaron Station Unit 7399
- 7297 Cimmaron Station
- 7321 Cimmaron Station Unit 7399
- 7295 Cimmaron Station
- 7323 Cimmaron Station Unit 7399
- 7293 Cimmaron Station
- 7327 Cimmaron Station Unit 7327
- 7329 Cimmaron Station Unit 7329
- 7287 Cimmaron Station
- 7289 Cimmaron Station
- 7331 Cimmaron Station Unit 7331
- 7333 Cimmaron Station Unit 7333
- 7283 Cimmaron Station