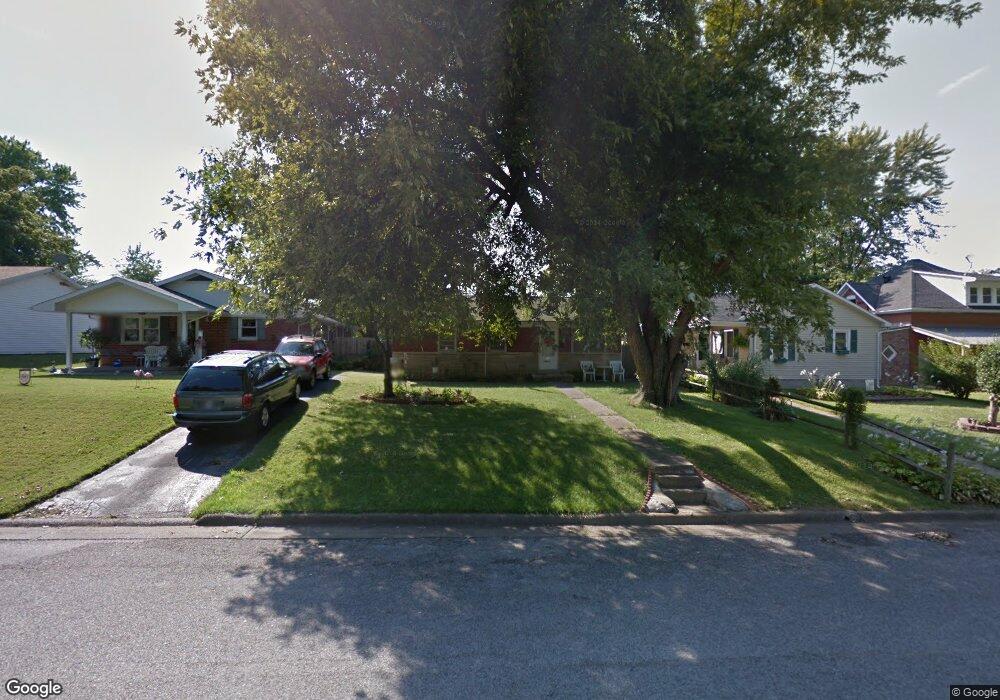
731 18th St Tell City, IN 47586
Estimated Value: $92,000 - $152,000
3
Beds
1
Bath
1,073
Sq Ft
$126/Sq Ft
Est. Value
About This Home
This home is located at 731 18th St, Tell City, IN 47586 and is currently estimated at $134,894, approximately $125 per square foot. 731 18th St is a home located in Perry County with nearby schools including William Tell Elementary School, Tell City Junior/Senior High School, and Agape Christian Academy.
Ownership History
Date
Name
Owned For
Owner Type
Purchase Details
Closed on
Nov 13, 2017
Sold by
Lincoln Heritage Inc
Bought by
Mullen Keller Samantha Jo
Current Estimated Value
Purchase Details
Closed on
May 2, 2015
Sold by
Stroud Floyd H and Stroud Mary F
Bought by
Lincoln Heritage Inc
Purchase Details
Closed on
Jan 31, 2014
Sold by
Hagedorn Walter Lee
Bought by
Hagedorn Walter Lee
Purchase Details
Closed on
Jul 8, 2010
Sold by
American General Financial Services Inc
Bought by
Stroud Floyd H and Stroud Mary F
Purchase Details
Closed on
Nov 25, 2009
Sold by
Mcdaniel Larry E and Mcdaniel Marilyn S
Bought by
American General Financial Services Inc
Create a Home Valuation Report for This Property
The Home Valuation Report is an in-depth analysis detailing your home's value as well as a comparison with similar homes in the area
Home Values in the Area
Average Home Value in this Area
Purchase History
| Date | Buyer | Sale Price | Title Company |
|---|---|---|---|
| Mullen Keller Samantha Jo | -- | None Available | |
| Lincoln Heritage Inc | -- | None Available | |
| Hagedorn Walter Lee | -- | Attorney | |
| Stroud Floyd H | -- | None Available | |
| American General Financial Services Inc | -- | None Available |
Source: Public Records
Tax History Compared to Growth
Tax History
| Year | Tax Paid | Tax Assessment Tax Assessment Total Assessment is a certain percentage of the fair market value that is determined by local assessors to be the total taxable value of land and additions on the property. | Land | Improvement |
|---|---|---|---|---|
| 2024 | $1,026 | $102,600 | $7,300 | $95,300 |
| 2023 | $961 | $98,000 | $7,300 | $90,700 |
| 2022 | $751 | $88,800 | $7,300 | $81,500 |
| 2021 | $628 | $77,600 | $7,300 | $70,300 |
| 2020 | $504 | $72,100 | $7,300 | $64,800 |
| 2019 | $479 | $68,500 | $7,000 | $61,500 |
| 2018 | $471 | $66,400 | $6,900 | $59,500 |
| 2017 | $453 | $64,400 | $6,900 | $57,500 |
| 2016 | $1,288 | $64,400 | $6,900 | $57,500 |
| 2014 | $121 | $64,700 | $6,900 | $57,800 |
| 2013 | $121 | $63,800 | $6,900 | $56,900 |
Source: Public Records
Map
Nearby Homes