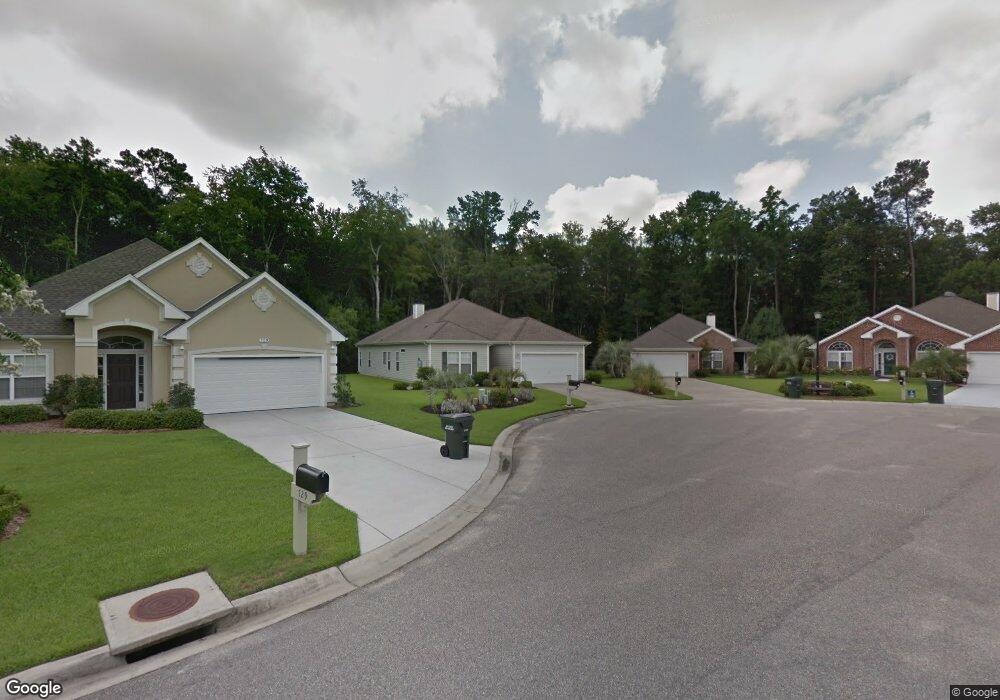
731 Dove Haven Ln Myrtle Beach, SC 29579
Estimated Value: $361,000 - $405,000
3
Beds
2
Baths
1,863
Sq Ft
$204/Sq Ft
Est. Value
About This Home
This home is located at 731 Dove Haven Ln, Myrtle Beach, SC 29579 and is currently estimated at $379,240, approximately $203 per square foot. 731 Dove Haven Ln is a home located in Horry County with nearby schools including River Oaks Elementary School, Ten Oaks Middle, and Carolina Forest High School.
Ownership History
Date
Name
Owned For
Owner Type
Purchase Details
Closed on
Jun 27, 2015
Sold by
Timpa Michael and Timpa Rose Ann
Bought by
Spoto Arlan L and Spoto Lois A
Current Estimated Value
Home Financials for this Owner
Home Financials are based on the most recent Mortgage that was taken out on this home.
Original Mortgage
$196,377
Outstanding Balance
$152,532
Interest Rate
3.75%
Mortgage Type
FHA
Estimated Equity
$226,708
Purchase Details
Closed on
Aug 25, 2009
Sold by
Wilson Louis A
Bought by
Timpa Michael
Purchase Details
Closed on
May 19, 2003
Sold by
Dr Horton Inc
Bought by
Wilson Louis A and Wilson Angela D
Home Financials for this Owner
Home Financials are based on the most recent Mortgage that was taken out on this home.
Original Mortgage
$177,165
Interest Rate
5.79%
Mortgage Type
Purchase Money Mortgage
Purchase Details
Closed on
Jul 10, 2001
Sold by
Starrpoint Properties Llc
Bought by
D R Horton Inc
Purchase Details
Closed on
Aug 31, 2000
Sold by
Lpc Of S C Inc
Bought by
Starrpoint Properties Llc
Create a Home Valuation Report for This Property
The Home Valuation Report is an in-depth analysis detailing your home's value as well as a comparison with similar homes in the area
Home Values in the Area
Average Home Value in this Area
Purchase History
| Date | Buyer | Sale Price | Title Company |
|---|---|---|---|
| Spoto Arlan L | $200,000 | -- | |
| Timpa Michael | $180,000 | -- | |
| Wilson Louis A | $186,490 | -- | |
| D R Horton Inc | $192,264 | -- | |
| Starrpoint Properties Llc | $3,058,384 | -- |
Source: Public Records
Mortgage History
| Date | Status | Borrower | Loan Amount |
|---|---|---|---|
| Open | Spoto Arlan L | $196,377 | |
| Previous Owner | Wilson Louis A | $177,165 |
Source: Public Records
Tax History Compared to Growth
Tax History
| Year | Tax Paid | Tax Assessment Tax Assessment Total Assessment is a certain percentage of the fair market value that is determined by local assessors to be the total taxable value of land and additions on the property. | Land | Improvement |
|---|---|---|---|---|
| 2024 | $856 | $14,501 | $5,425 | $9,076 |
| 2023 | $856 | $8,987 | $1,768 | $7,219 |
| 2021 | $751 | $10,242 | $2,110 | $8,132 |
| 2020 | $653 | $10,242 | $2,110 | $8,132 |
| 2019 | $653 | $10,242 | $2,110 | $8,132 |
| 2018 | $565 | $7,814 | $1,534 | $6,280 |
| 2017 | $729 | $7,814 | $1,534 | $6,280 |
| 2016 | -- | $7,814 | $1,534 | $6,280 |
| 2015 | $729 | $7,815 | $1,535 | $6,280 |
| 2014 | $2,438 | $11,722 | $2,302 | $9,420 |
Source: Public Records
Map
Nearby Homes
- 801 Abalone Ct Unit MB
- 673 Tidal Point Ln
- 677 Tidal Point Ln
- 809 Covelo Ln
- 636 Barona Dr
- 1228 Lanterns Rest Rd
- 600 Barona Dr
- 670 Riverwalk Dr Unit 303
- 125 Lac Courte
- 1224 Safe Haven Dr
- 683 Riverwalk Dr Unit 302
- 1433 Lanterns Rest Rd Unit 1433
- 424 Pomo Dr
- 1101 Peace Pipe Place Unit 104
- 1101 Peace Pipe Place Unit 201
- 1479 Lanterns Rest Rd Unit 1479
- 686 Riverwalk Dr Unit 204
- 695 Riverwalk Dr Unit 102
- 200 Yam Dr Unit F
- 690 Riverwalk Dr Unit Riverwalk 201
- 729 Dove Haven Ln
- 737 Dove Haven Ln
- 739 Dove Haven Ln
- 727 Dove Haven Ln
- 738 Dove Haven Ln
- 738 Dove Haven Ln
- 734 Dove Haven Ln Unit MB
- 736 Dove Haven Ln
- 725 Dove Haven Ln
- 725 Dove Haven Ln
- 732 Dove Haven Ln
- 723 Dove Haven Ln Unit Arrowhead-Sandstone
- 723 Dove Haven Ln Unit Arrowhead - Sandston
- 723 Dove Haven Ln
- 413 Oxner Ct Unit Arrowhead
- 413 Oxner Ct Unit Arrowhead: Sandstone
- 414 Oxner Ct
- 409 Oxner Ct
- 722 Dove Haven Ln
- 721 Dove Haven Ln