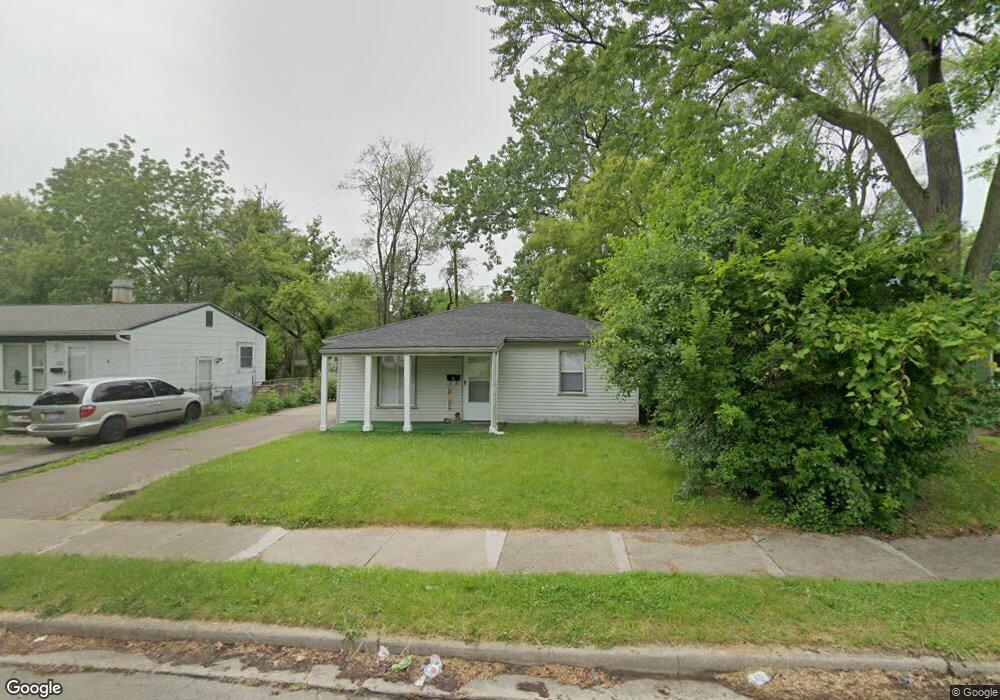
731 Emerson Ave Unit Bldg-Unit Pontiac, MI 48340
Estimated Value: $88,000 - $93,834
2
Beds
1
Bath
717
Sq Ft
$127/Sq Ft
Est. Value
About This Home
This home is located at 731 Emerson Ave Unit Bldg-Unit, Pontiac, MI 48340 and is currently estimated at $90,709, approximately $126 per square foot. 731 Emerson Ave Unit Bldg-Unit is a home located in Oakland County with nearby schools including Herrington Elementary School, Pontiac Middle School, and Pontiac High School.
Ownership History
Date
Name
Owned For
Owner Type
Purchase Details
Closed on
Jun 3, 2024
Sold by
Dropiewski Kaylan Charles
Bought by
Level 7 Properties Llc
Current Estimated Value
Purchase Details
Closed on
Jun 27, 2018
Sold by
Nieves Homes Llc
Bought by
Dropiewski Kaylan Charles
Purchase Details
Closed on
Sep 4, 2012
Sold by
Rose Grover C
Bought by
Nieves Homes Llc N
Purchase Details
Closed on
Aug 30, 2004
Sold by
Commercial Federal Mortgage Corp
Bought by
Rose Grover C
Purchase Details
Closed on
Apr 1, 2003
Sold by
Nelson Gary D and Nelson Angela L
Bought by
Commercial Federal Mortgage Corp
Purchase Details
Closed on
Nov 10, 2000
Sold by
Harrold Robert L
Bought by
Nelson G
Purchase Details
Closed on
Oct 9, 1989
Sold by
Alexander Wilbert T
Bought by
Harrold Robert L
Create a Home Valuation Report for This Property
The Home Valuation Report is an in-depth analysis detailing your home's value as well as a comparison with similar homes in the area
Home Values in the Area
Average Home Value in this Area
Purchase History
| Date | Buyer | Sale Price | Title Company |
|---|---|---|---|
| Level 7 Properties Llc | $85,000 | None Listed On Document | |
| Level 7 Properties Llc | $85,000 | None Listed On Document | |
| Dropiewski Kaylan Charles | -- | Ata National Title Group Llc | |
| Nieves Homes Llc N | $12,000 | Seaver Title Agency Llc | |
| Rose Grover C | $22,000 | Preferred Title Agency Corp | |
| Commercial Federal Mortgage Corp | $53,138 | -- | |
| Nelson G | $47,380 | -- | |
| Harrold Robert L | $10,500 | -- |
Source: Public Records
Mortgage History
| Date | Status | Borrower | Loan Amount |
|---|---|---|---|
| Closed | Nelson G | -- |
Source: Public Records
Tax History Compared to Growth
Tax History
| Year | Tax Paid | Tax Assessment Tax Assessment Total Assessment is a certain percentage of the fair market value that is determined by local assessors to be the total taxable value of land and additions on the property. | Land | Improvement |
|---|---|---|---|---|
| 2024 | $662 | $29,190 | $0 | $0 |
| 2023 | $631 | $26,810 | $0 | $0 |
| 2022 | $676 | $23,190 | $0 | $0 |
| 2021 | $657 | $20,260 | $0 | $0 |
| 2020 | $574 | $18,030 | $0 | $0 |
| 2019 | $632 | $15,340 | $0 | $0 |
| 2018 | $569 | $13,470 | $0 | $0 |
| 2017 | $2,110 | $12,770 | $0 | $0 |
| 2016 | $577 | $10,850 | $0 | $0 |
| 2015 | -- | $9,890 | $0 | $0 |
| 2014 | -- | $9,610 | $0 | $0 |
| 2011 | -- | $17,400 | $0 | $0 |
Source: Public Records
Map
Nearby Homes
- 715 Kenilworth Ave
- 770 Cameron Ave
- 790 Cameron Ave
- 785 Kenilworth Ave
- 457 Cameron Ave
- 802 Cameron Ave
- 808 Kettering Ave
- 644 Brady Ln
- 1163 Chestnut St Unit 9
- 608 Brady Ln
- 602 Brady Ln
- 821 Robinwood St
- 509 Cameron Ave
- 597 Brady Ln
- 591 Brady Ln
- 790 Parkwood Ave
- 1240 University Dr Unit 2
- Fairfiled Plan at Fairview Village
- Enclave II Plan at Fairview Village
- Enclave Plan at Fairview Village
- 731 Emerson Ave
- 735 Emerson Ave
- 725 Emerson Ave
- 741 Emerson Ave
- 721 Emerson Ave
- 730 Cameron Ave
- 724 Cameron Ave
- 715 Emerson Ave
- 720 Cameron Ave
- 730 Emerson Ave
- 724 Emerson Ave
- 714 Cameron Ave
- 751 Emerson Ave
- 720 Emerson Ave
- 740 Emerson Ave
- 714 Emerson Ave
- 710 Cameron Ave
- 750 Cameron Ave
- 755 Emerson Ave