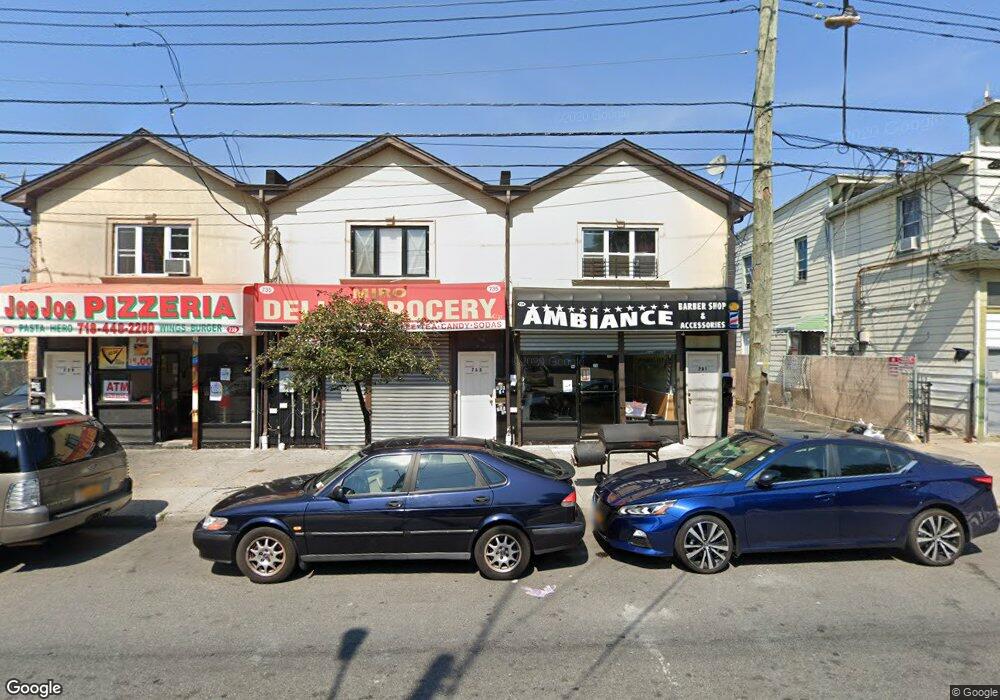
731 Henderson Ave Unit 731-739 Staten Island, NY 10310
West Brighton NeighborhoodEstimated Value: $1,776,225
--
Bed
--
Bath
3,200
Sq Ft
$555/Sq Ft
Est. Value
About This Home
This home is located at 731 Henderson Ave Unit 731-739, Staten Island, NY 10310 and is currently estimated at $1,776,225, approximately $555 per square foot. 731 Henderson Ave Unit 731-739 is a home located in Richmond County with nearby schools including P.S. 18 John G. Whittier, Intermediate School 27, and Susan E Wagner High School.
Ownership History
Date
Name
Owned For
Owner Type
Purchase Details
Closed on
Sep 27, 2016
Sold by
Henderson Realty Llc
Bought by
C & Y 2016 Inc
Current Estimated Value
Home Financials for this Owner
Home Financials are based on the most recent Mortgage that was taken out on this home.
Original Mortgage
$660,000
Outstanding Balance
$528,778
Interest Rate
3.44%
Mortgage Type
Commercial
Estimated Equity
$1,247,447
Purchase Details
Closed on
Feb 1, 2005
Sold by
Ricca Joseph
Bought by
Henderson Realty Llc
Purchase Details
Closed on
Aug 3, 2004
Sold by
Arpaia Michael and Arpaia Jennifer
Bought by
Ricca Joseph
Purchase Details
Closed on
Dec 17, 2003
Sold by
735 Henderson Avenue Realty Corp
Bought by
Arpaia Michael and Arpaia Jennifer
Create a Home Valuation Report for This Property
The Home Valuation Report is an in-depth analysis detailing your home's value as well as a comparison with similar homes in the area
Home Values in the Area
Average Home Value in this Area
Purchase History
| Date | Buyer | Sale Price | Title Company |
|---|---|---|---|
| C & Y 2016 Inc | $1,070,000 | None Available | |
| Henderson Realty Llc | $475,000 | First Amer Title Ins Co Ny | |
| Ricca Joseph | $190,000 | First Amer Title Ins Co Ny | |
| Arpaia Michael | $100,000 | First American Title Insuran |
Source: Public Records
Mortgage History
| Date | Status | Borrower | Loan Amount |
|---|---|---|---|
| Open | C & Y 2016 Inc | $660,000 |
Source: Public Records
Tax History Compared to Growth
Tax History
| Year | Tax Paid | Tax Assessment Tax Assessment Total Assessment is a certain percentage of the fair market value that is determined by local assessors to be the total taxable value of land and additions on the property. | Land | Improvement |
|---|---|---|---|---|
| 2025 | $6,149 | $40,560 | $12,594 | $27,966 |
| 2024 | $6,149 | $34,080 | $14,875 | $19,205 |
| 2023 | $5,865 | $28,880 | $11,879 | $17,001 |
| 2022 | $5,439 | $37,260 | $16,560 | $20,700 |
| 2021 | $5,409 | $33,960 | $16,560 | $17,400 |
| 2020 | $5,454 | $31,620 | $16,560 | $15,060 |
| 2019 | $5,350 | $27,480 | $16,560 | $10,920 |
| 2018 | $4,906 | $24,067 | $14,599 | $9,468 |
| 2017 | $4,628 | $22,705 | $14,641 | $8,064 |
| 2016 | $4,282 | $21,420 | $16,560 | $4,860 |
| 2015 | $4,836 | $25,200 | $16,560 | $8,640 |
| 2014 | $4,836 | $25,200 | $16,560 | $8,640 |
Source: Public Records
Map
Nearby Homes
- 731 Henderson Ave Unit 739
- 731 Henderson Ave
- 735 Henderson Ave
- 727 Henderson Ave Unit 727-729
- 727 Henderson Ave Unit 729
- 739 Henderson Ave
- 725 Henderson Ave
- 171 Broadway
- 721 Henderson Ave Unit 721-723
- 721 Henderson Ave
- 721-723 Henderson Ave
- 128 Campbell Ave
- 159 Broadway
- 153 Broadway
- 0 Campbell Ave
- 711 Henderson Ave
- 116 Campbell Ave
- 709 Henderson Ave Unit 2
- 709 Henderson Ave
- 149 Broadway