Estimated Value: $345,165 - $420,000
3
Beds
1
Bath
1,372
Sq Ft
$268/Sq Ft
Est. Value
About This Home
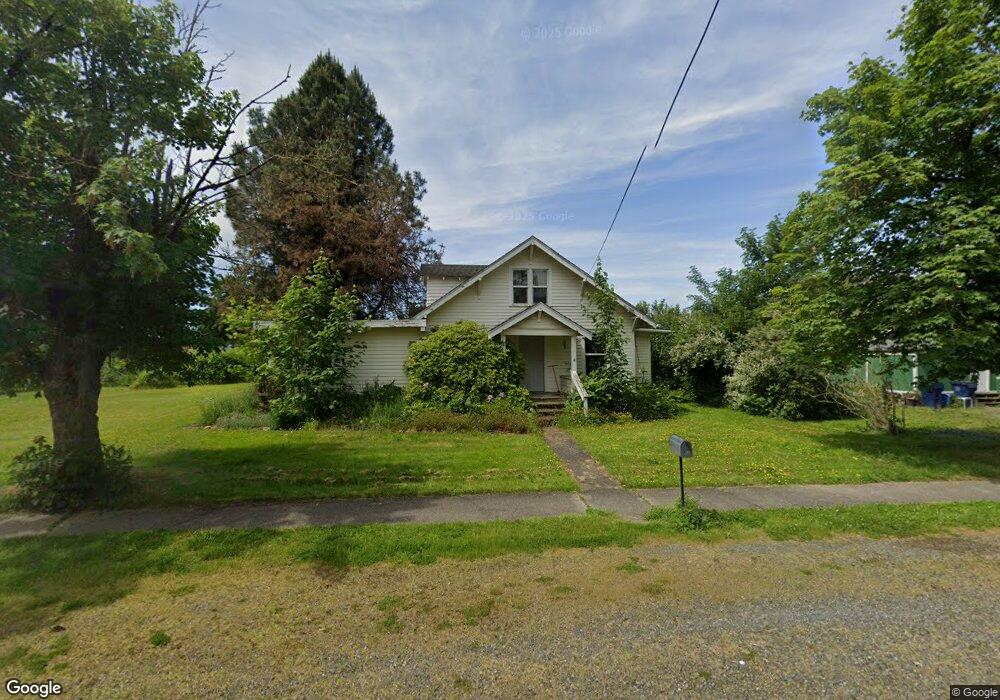
This home is located at 731 Lawson St, Sumas, WA 98295 and is currently estimated at $368,041, approximately $268 per square foot. 731 Lawson St is a home located in Whatcom County with nearby schools including Sumas Elementary School, Nooksack Elementary School, and Everson Elementary School.
Ownership History
Date
Name
Owned For
Owner Type
Purchase Details
Closed on
Sep 23, 2011
Sold by
Federal National Mortgage Association
Bought by
Dibley David L
Current Estimated Value
Home Financials for this Owner
Home Financials are based on the most recent Mortgage that was taken out on this home.
Original Mortgage
$111,986
Interest Rate
4.12%
Mortgage Type
FHA
Purchase Details
Closed on
Mar 3, 2011
Sold by
Riley Mark and Riley Cynthia
Bought by
Federal National Mortgage Association
Purchase Details
Closed on
Mar 7, 2007
Sold by
Handerson Bonnie J
Bought by
Riley Mark and Riley Cynthia
Home Financials for this Owner
Home Financials are based on the most recent Mortgage that was taken out on this home.
Original Mortgage
$163,800
Interest Rate
6.23%
Mortgage Type
Purchase Money Mortgage
Create a Home Valuation Report for This Property
The Home Valuation Report is an in-depth analysis detailing your home's value as well as a comparison with similar homes in the area
Home Values in the Area
Average Home Value in this Area
Purchase History
| Date | Buyer | Sale Price | Title Company |
|---|---|---|---|
| Dibley David L | $114,900 | Chicago Title Insurance | |
| Federal National Mortgage Association | $145,098 | None Available | |
| Riley Mark | $164,080 | Chicago Title Insurance |
Source: Public Records
Mortgage History
| Date | Status | Borrower | Loan Amount |
|---|---|---|---|
| Previous Owner | Dibley David L | $111,986 | |
| Previous Owner | Riley Mark | $163,800 |
Source: Public Records
Tax History Compared to Growth
Tax History
| Year | Tax Paid | Tax Assessment Tax Assessment Total Assessment is a certain percentage of the fair market value that is determined by local assessors to be the total taxable value of land and additions on the property. | Land | Improvement |
|---|---|---|---|---|
| 2024 | $1,397 | $195,577 | $143,000 | $52,577 |
| 2023 | $1,397 | $146,019 | $103,308 | $42,711 |
| 2022 | $2,369 | $131,551 | $93,072 | $38,479 |
| 2021 | $2,252 | $206,476 | $76,920 | $129,556 |
| 2020 | $2,159 | $167,871 | $62,538 | $105,333 |
| 2019 | $1,831 | $167,871 | $62,538 | $105,333 |
| 2018 | $2,051 | $161,058 | $60,000 | $101,058 |
| 2017 | $1,827 | $138,712 | $32,480 | $106,232 |
| 2016 | $1,738 | $128,006 | $29,960 | $98,046 |
| 2015 | $1,563 | $122,758 | $28,896 | $93,862 |
| 2014 | -- | $118,952 | $28,000 | $90,952 |
| 2013 | -- | $118,952 | $28,000 | $90,952 |
Source: Public Records
Map
Nearby Homes
- 310 Second St
- 124 Columbia St
- 136 First St
- 242 Morton St
- 230 Gough St
- 555 Morton St
- 217 Noble St
- 1005 Johnson St
- 4355 Jones Rd
- 4135 Kamphouse Dr
- 5326 Reese Hill Rd
- 5363 Reese Hill Rd
- 5376 Reese Hill Rd
- 48 XX Reese Hill Rd
- 8381 N Telegraph Rd
- 5615 S Pass Rd
- 6801 S Pass Rd
- 9919 Holmquist Rd
- 3630 Sorenson Rd
- 201 Brentwood Dr