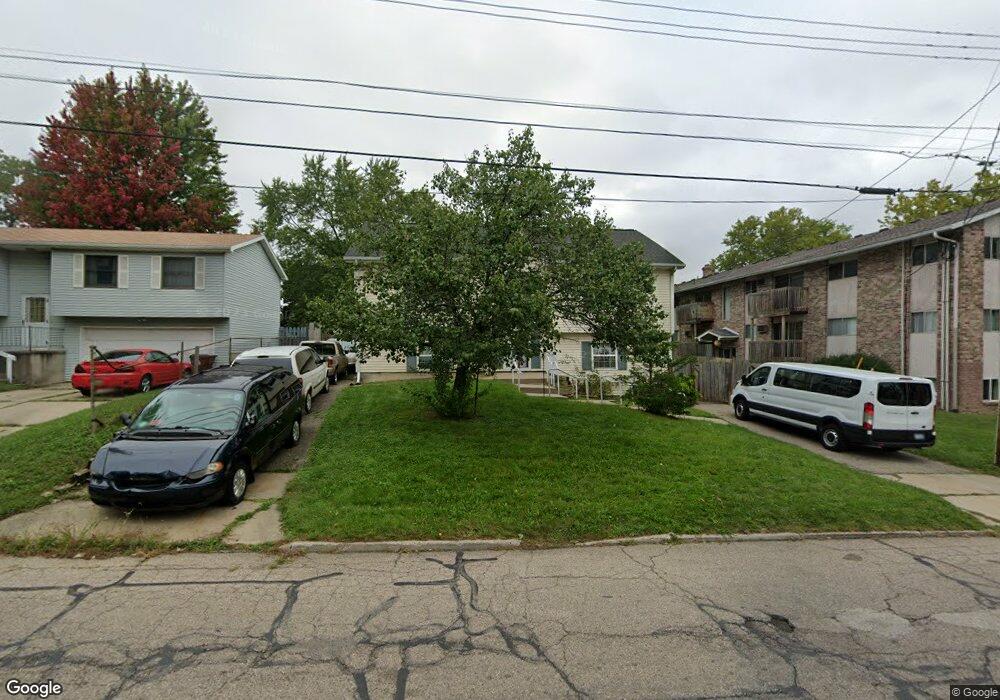
731 Louisa St Lansing, MI 48911
South Lansing NeighborhoodEstimated Value: $160,000 - $417,813
2
Beds
1
Bath
2,264
Sq Ft
$114/Sq Ft
Est. Value
About This Home
This home is located at 731 Louisa St, Lansing, MI 48911 and is currently estimated at $257,953, approximately $113 per square foot. 731 Louisa St is a home located in Ingham County with nearby schools including Kendon School, Attwood School, and Everett High School.
Ownership History
Date
Name
Owned For
Owner Type
Purchase Details
Closed on
Jun 16, 2015
Sold by
Morton Estelle
Bought by
Masambaji Anna
Current Estimated Value
Purchase Details
Closed on
May 9, 2015
Sold by
Adatsi George
Bought by
Masambaji Anna
Purchase Details
Closed on
May 10, 2006
Sold by
Louisa Street Llc
Bought by
Morton Don C and Don C Morton Living Trust
Purchase Details
Closed on
Dec 20, 2002
Sold by
Louisa Street Llc
Bought by
Adatsi George and Masambaji Anna
Purchase Details
Closed on
Nov 19, 2002
Sold by
Morton Don C and Morton Bette I
Bought by
Louisa Street Llc
Create a Home Valuation Report for This Property
The Home Valuation Report is an in-depth analysis detailing your home's value as well as a comparison with similar homes in the area
Home Values in the Area
Average Home Value in this Area
Purchase History
| Date | Buyer | Sale Price | Title Company |
|---|---|---|---|
| Masambaji Anna | $159,900 | Attorney | |
| Masambaji Anna | -- | None Available | |
| Morton Don C | -- | None Available | |
| Adatsi George | -- | Metropolitan Title Okemos Se | |
| Louisa Street Llc | -- | Metro |
Source: Public Records
Tax History Compared to Growth
Tax History
| Year | Tax Paid | Tax Assessment Tax Assessment Total Assessment is a certain percentage of the fair market value that is determined by local assessors to be the total taxable value of land and additions on the property. | Land | Improvement |
|---|---|---|---|---|
| 2025 | $4,666 | $69,800 | $8,300 | $61,500 |
| 2024 | $38 | $71,100 | $8,300 | $62,800 |
| 2023 | $4,393 | $66,000 | $8,300 | $57,700 |
| 2022 | $4,014 | $61,700 | $7,600 | $54,100 |
| 2021 | $3,922 | $59,600 | $7,200 | $52,400 |
| 2020 | $3,893 | $58,700 | $7,200 | $51,500 |
| 2019 | $3,759 | $50,700 | $7,200 | $43,500 |
| 2018 | $3,567 | $47,600 | $7,200 | $40,400 |
| 2017 | $3,432 | $47,600 | $7,200 | $40,400 |
| 2016 | $3,497 | $44,000 | $7,200 | $36,800 |
| 2015 | $3,497 | $43,900 | $14,358 | $29,542 |
| 2014 | $3,497 | $44,800 | $17,672 | $27,128 |
Source: Public Records
Map
Nearby Homes
- 5724 Orchard Ct
- 5750 Orchard Ct
- 5808 Orchard Ct
- 354 E Miller Rd
- 1101 Barr Ave
- 123 E Miller Rd
- 4901 Allison Dr
- 4901 Southgate Ave
- 6223 Beechfield Dr Unit 8
- 5636 Ellendale Dr
- 6029 Ellendale Dr
- 6300 Beechfield Dr Unit 87
- 6309 Beechfield Dr Unit 45
- 4733 S Pennsylvania Ave
- 6028 Rolfe Rd
- 5011 Stafford Ave
- 5821 Schafer Rd
- 501 Bluebell Dr
- 201 E Syringa Dr
- 6429 Rosedale Rd