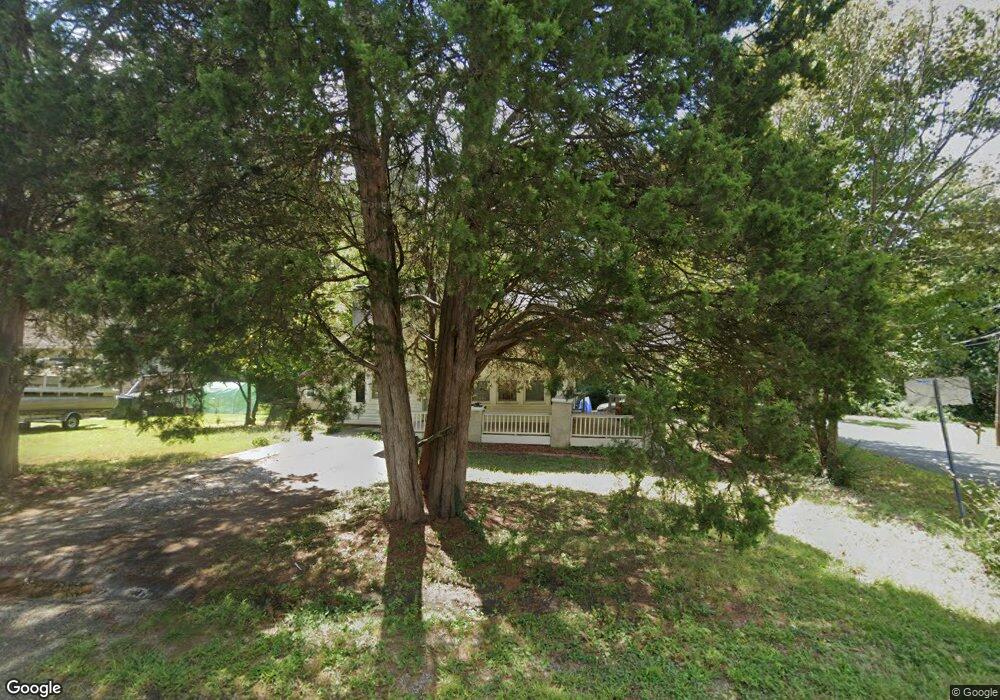
731 Peyton Ave Durham, NC 27703
Bethesda NeighborhoodEstimated Value: $305,000 - $392,000
2
Beds
2
Baths
1,337
Sq Ft
$258/Sq Ft
Est. Value
About This Home
This home is located at 731 Peyton Ave, Durham, NC 27703 and is currently estimated at $344,912, approximately $257 per square foot. 731 Peyton Ave is a home located in Durham County with nearby schools including Bethesda Elementary School, John W Neal Middle School, and Southern School of Energy & Sustainability.
Ownership History
Date
Name
Owned For
Owner Type
Purchase Details
Closed on
Jan 30, 2014
Sold by
Wu Hongsheng
Bought by
Wu Hongsheng and Wu Angelina
Current Estimated Value
Purchase Details
Closed on
Jan 21, 2014
Sold by
Federal Home Loan Mortgage Corporation
Bought by
Wu Hongsheng
Purchase Details
Closed on
Sep 18, 2013
Sold by
Gowan George Layton and Meade Cheryl Ann
Bought by
Federal Home Loan Mortgage Corporation
Purchase Details
Closed on
May 6, 2005
Sold by
Norkar Inc
Bought by
Gowan George Layton and Meade Cheryl Ann
Home Financials for this Owner
Home Financials are based on the most recent Mortgage that was taken out on this home.
Original Mortgage
$103,920
Interest Rate
5.88%
Mortgage Type
Fannie Mae Freddie Mac
Purchase Details
Closed on
Oct 13, 2004
Sold by
Howerton Virginia Lois
Bought by
Norkar Inc
Create a Home Valuation Report for This Property
The Home Valuation Report is an in-depth analysis detailing your home's value as well as a comparison with similar homes in the area
Home Values in the Area
Average Home Value in this Area
Purchase History
| Date | Buyer | Sale Price | Title Company |
|---|---|---|---|
| Wu Hongsheng | -- | None Available | |
| Wu Hongsheng | -- | None Available | |
| Federal Home Loan Mortgage Corporation | -- | None Available | |
| Gowan George Layton | $130,000 | -- | |
| Norkar Inc | $40,000 | -- |
Source: Public Records
Mortgage History
| Date | Status | Borrower | Loan Amount |
|---|---|---|---|
| Previous Owner | Gowan George Layton | $103,920 |
Source: Public Records
Tax History
| Year | Tax Paid | Tax Assessment Tax Assessment Total Assessment is a certain percentage of the fair market value that is determined by local assessors to be the total taxable value of land and additions on the property. | Land | Improvement |
|---|---|---|---|---|
| 2025 | $2,236 | $307,521 | $105,000 | $202,521 |
| 2024 | $1,492 | $133,821 | $24,060 | $109,761 |
| 2023 | $1,387 | $133,821 | $24,060 | $109,761 |
| 2022 | $1,387 | $133,821 | $24,060 | $109,761 |
| 2021 | $1,174 | $133,821 | $24,060 | $109,761 |
| 2020 | $1,147 | $133,821 | $24,060 | $109,761 |
| 2019 | $1,134 | $133,821 | $24,060 | $109,761 |
| 2018 | $1,006 | $109,021 | $24,060 | $84,961 |
| 2017 | $974 | $109,021 | $24,060 | $84,961 |
| 2016 | $944 | $109,021 | $24,060 | $84,961 |
| 2015 | $1,273 | $122,835 | $15,863 | $106,972 |
| 2014 | $1,279 | $122,835 | $15,863 | $106,972 |
Source: Public Records
Map
Nearby Homes
- 727A Peyton Ave
- 3857 Angier Ave
- 1017 Depot Dr
- 1012 Depot Dr
- 3105 Ranger Dr
- 3112 Ranger Dr
- 3908 Cash Rd
- 1923 Hinesley Dr
- 1821 S Mineral Springs Rd
- 1936 Hinesley Dr
- 1940 Hinesley Dr
- 1938 Hinesley Dr
- 1932 Hinesley Dr
- 1934 Hinesley Dr
- 1948 Hinesley Dr
- 1950 Hinesley Dr
- 1944 Hinesley Dr
- 1942 Hinesley Dr
- 3205 Gypsum Dr
- 3207 Gypsum Dr
- 729 Peyton Ave
- 730 Peyton Ave
- 1600 Marly Dr
- 4001 Angier Ave
- 1610 Marly Dr
- 1542 Marly Dr
- 728 Peyton Ave
- 727 Peyton Ave
- 727 Peyton Ave Unit B
- 727 Peyton Ave Unit A
- 725 Peyton Ave
- 1535 Marly Dr
- 1538 Marly Dr
- 722 Peyton Ave
- 3915 Angier Ave
- 4003 Angier Ave
- 4002 Angier Ave
- 721 Peyton Ave
- 720 Peyton Ave
- 3930 Angier Ave
Your Personal Tour Guide
Ask me questions while you tour the home.