
Seller's Agent in 2025
Pamela Stayden
LPT Realty, LLC
(760) 914-3261
1 in this area
62 Total Sales
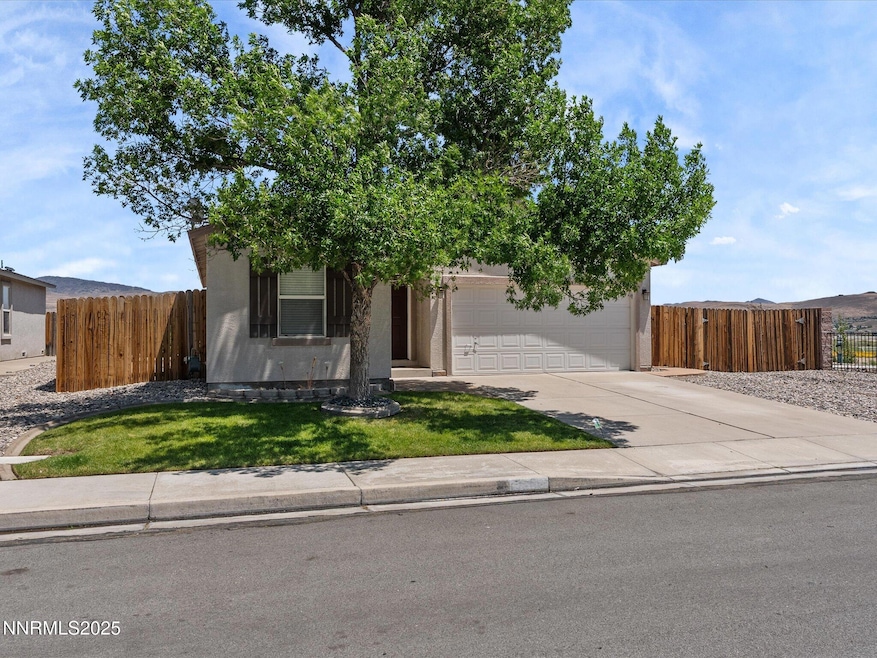


Step into this well-maintained single level home in the desirable Serena Springs neighborhood. The home sits on a cul-de-sac and adjoins open space for additional privacy, breathtaking mountain views and stunning sunrises. Enjoy the tranquil backyard setting for all your summer afternoon activities and outdoor dining. This well-priced home with low property taxes is close to shopping, schools, and a scenic pedestrian path right out your front door to the Spanish Springs Library and Lazy 5 Regional Park.
Appreciate the convenience of dedicated RV parking and a storage shed is perfect for all your gear, tools and projects. Windows replaced in 2022, newer flooring throughout, and new microwave in kitchen. 240 Volt in the garage available for an EV charger. This is an ideal starter home or investment property.
Last Agent to Sell the Property
LPT Realty, LLC License #S.187616 Listed on: 06/18/2025
| Date | Type | Sale Price | Title Company |
|---|---|---|---|
| Bargain Sale Deed | $410,000 | Magnus Title Agency Of Nevada | |
| Quit Claim Deed | -- | Solidifi Title & Closing | |
| Personal Reps Deed | -- | Guerra Bert | |
| Bargain Sale Deed | $130,500 | First Centennial Reno | |
| Bargain Sale Deed | $236,000 | Commerce Title Company |
| Date | Status | Loan Amount | Loan Type |
|---|---|---|---|
| Open | $328,000 | New Conventional | |
| Previous Owner | $130,500 | New Conventional | |
| Previous Owner | $50,000 | Future Advance Clause Open End Mortgage | |
| Previous Owner | $34,000 | Future Advance Clause Open End Mortgage | |
| Previous Owner | $65,000 | Credit Line Revolving | |
| Previous Owner | $188,650 | Unknown | |
| Previous Owner | $47,150 | Credit Line Revolving |
| Date | Event | Price | Change | Sq Ft Price |
|---|---|---|---|---|
| 07/21/2025 07/21/25 | Sold | $410,000 | -2.4% | $379 / Sq Ft |
| 06/18/2025 06/18/25 | For Sale | $420,000 | -- | $388 / Sq Ft |
| Year | Tax Paid | Tax Assessment Tax Assessment Total Assessment is a certain percentage of the fair market value that is determined by local assessors to be the total taxable value of land and additions on the property. | Land | Improvement |
|---|---|---|---|---|
| 2025 | $1,598 | $83,189 | $31,745 | $51,444 |
| 2024 | $1,598 | $77,985 | $26,180 | $51,805 |
| 2023 | $1,552 | $79,018 | $30,170 | $48,848 |
| 2022 | $1,505 | $64,465 | $23,835 | $40,630 |
| 2021 | $1,463 | $59,773 | $19,390 | $40,383 |
| 2020 | $1,418 | $60,664 | $20,265 | $40,399 |
| 2019 | $1,377 | $57,879 | $18,830 | $39,049 |
| 2018 | $1,337 | $50,872 | $12,670 | $38,202 |
| 2017 | $1,299 | $50,129 | $11,900 | $38,229 |
| 2016 | $1,260 | $49,214 | $11,130 | $38,084 |
| 2015 | $319 | $47,909 | $9,905 | $38,004 |
| 2014 | $1,222 | $39,578 | $7,000 | $32,578 |
| 2013 | -- | $32,670 | $5,845 | $26,825 |
Seller's Agent in 2025
Pamela Stayden
LPT Realty, LLC
(760) 914-3261
1 in this area
62 Total Sales
Seller Co-Listing Agent in 2025
Anthony Smith
LPT Realty, LLC
(510) 812-4999
1 in this area
47 Total Sales
Buyer's Agent in 2025
Megan Hong
LPT Realty, LLC
(775) 203-9084
1 in this area
77 Total Sales
Source: Northern Nevada Regional MLS
MLS Number: 250051711
APN: 528-171-06
Disclaimer: Certain information contained herein is derived from information provided by parties other than Homes.com. All information provided is deemed reliable, but is not guaranteed to be accurate and should be independently verified.
![]() IDX information is provided exclusively for personal, non-commercial use, and may not be used for any purpose other than to identify prospective properties consumers may be interested in purchasing. Information is deemed reliable but not guaranteed. The content relating to real estate for sale on this web site comes in part from the Broker Reciprocity/ IDX program of the Northern Nevada Regional Multiple Listing Service°. Real estate listings held by brokerage firms other than Ten-X are marked with the Broker Reciprocity logo and detailed information about those listings includes the name of the listing brokerage. Any use of the content other than by a search performed by a consumer looking to purchase or rent real estate is prohibited. © 2025 Northern Nevada Regional Multiple Listing Service® MLS. All rights reserved.
IDX information is provided exclusively for personal, non-commercial use, and may not be used for any purpose other than to identify prospective properties consumers may be interested in purchasing. Information is deemed reliable but not guaranteed. The content relating to real estate for sale on this web site comes in part from the Broker Reciprocity/ IDX program of the Northern Nevada Regional Multiple Listing Service°. Real estate listings held by brokerage firms other than Ten-X are marked with the Broker Reciprocity logo and detailed information about those listings includes the name of the listing brokerage. Any use of the content other than by a search performed by a consumer looking to purchase or rent real estate is prohibited. © 2025 Northern Nevada Regional Multiple Listing Service® MLS. All rights reserved.